TanHef Ranks — Find Tops & Bottoms
Easy-to-read signals with time-saving alerts. No Repainting! ⓘ
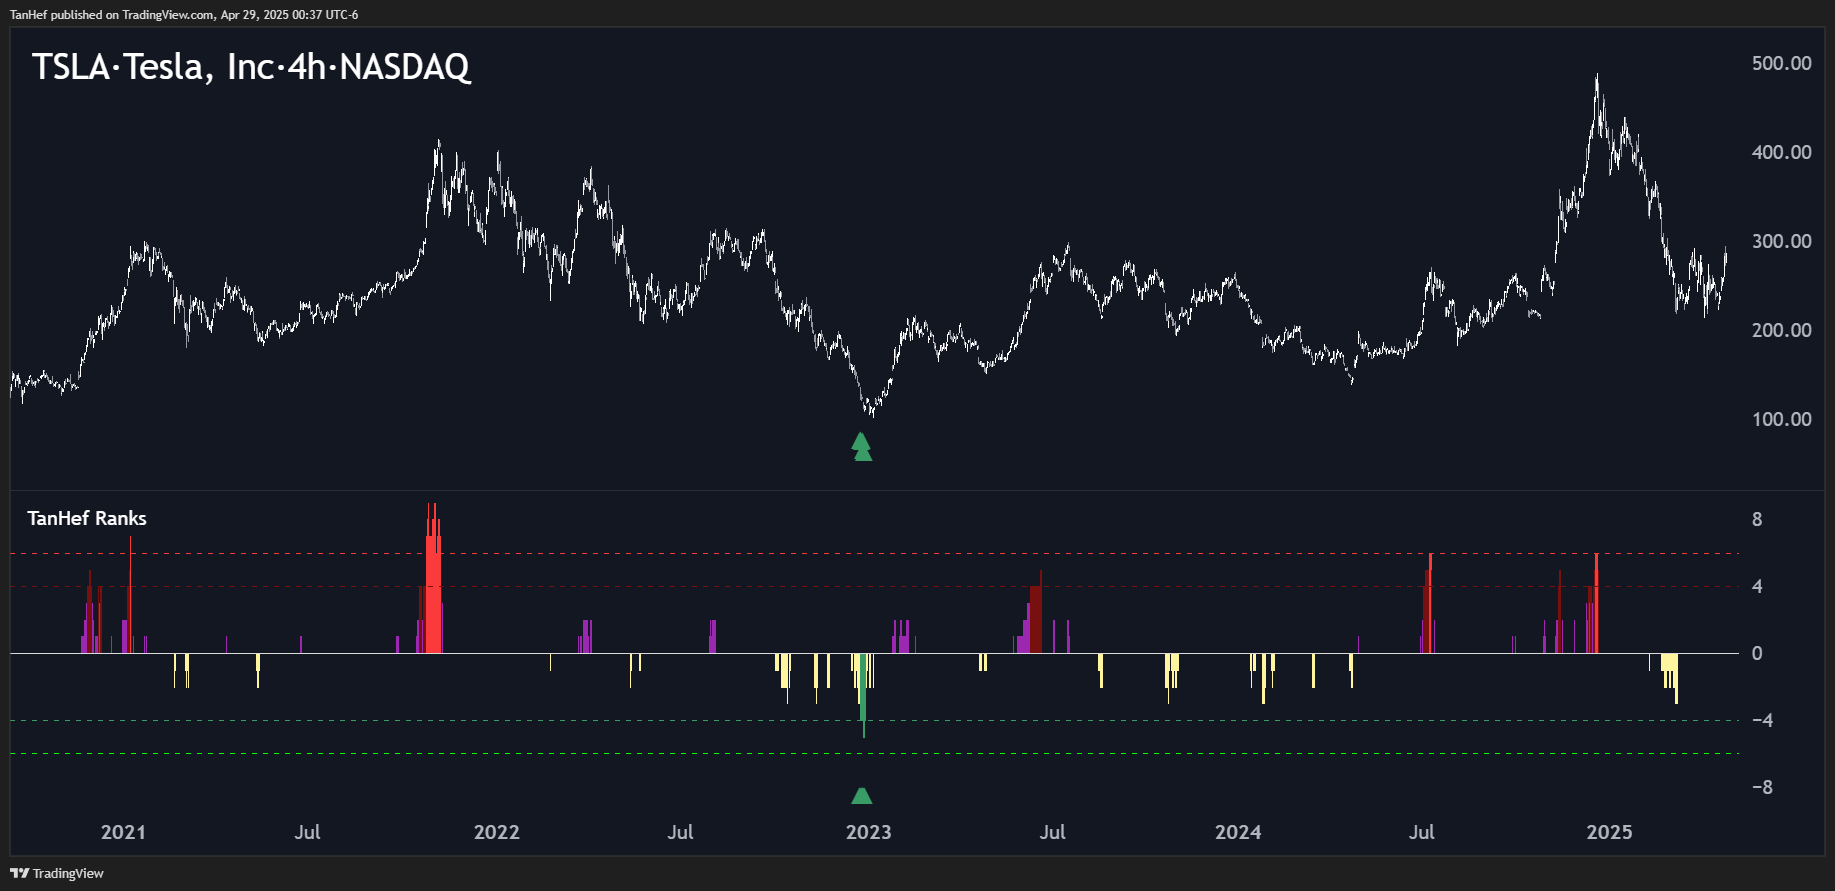
2022 Low (+1000%)
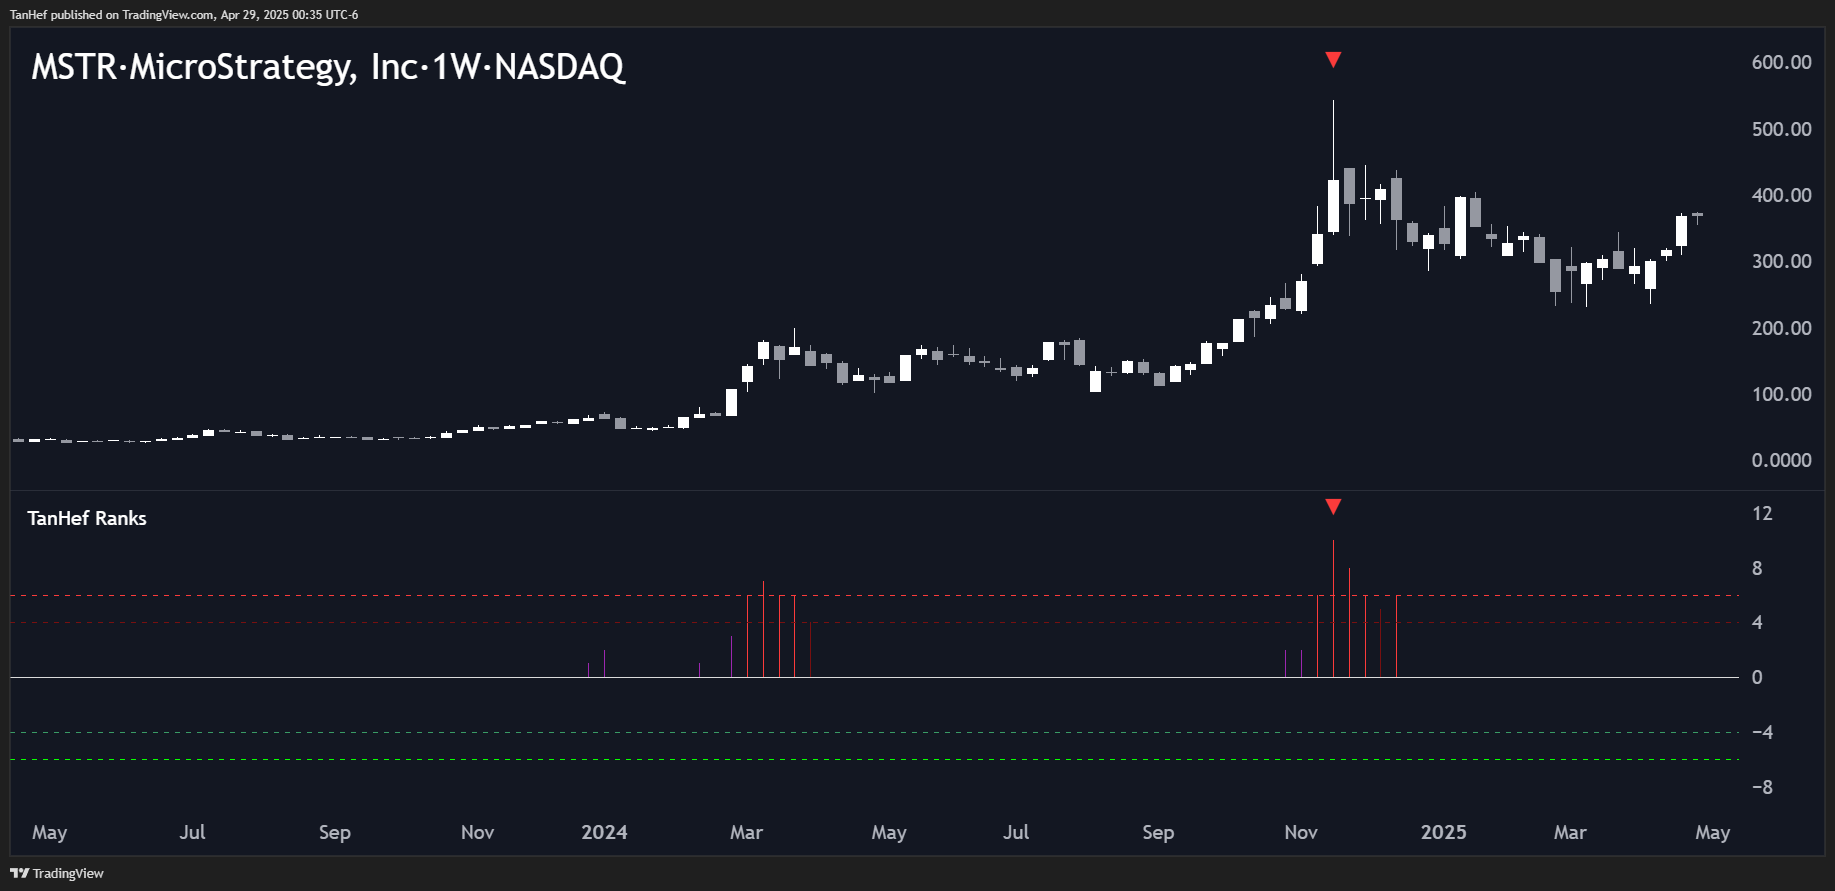
2024 Top (-47%)
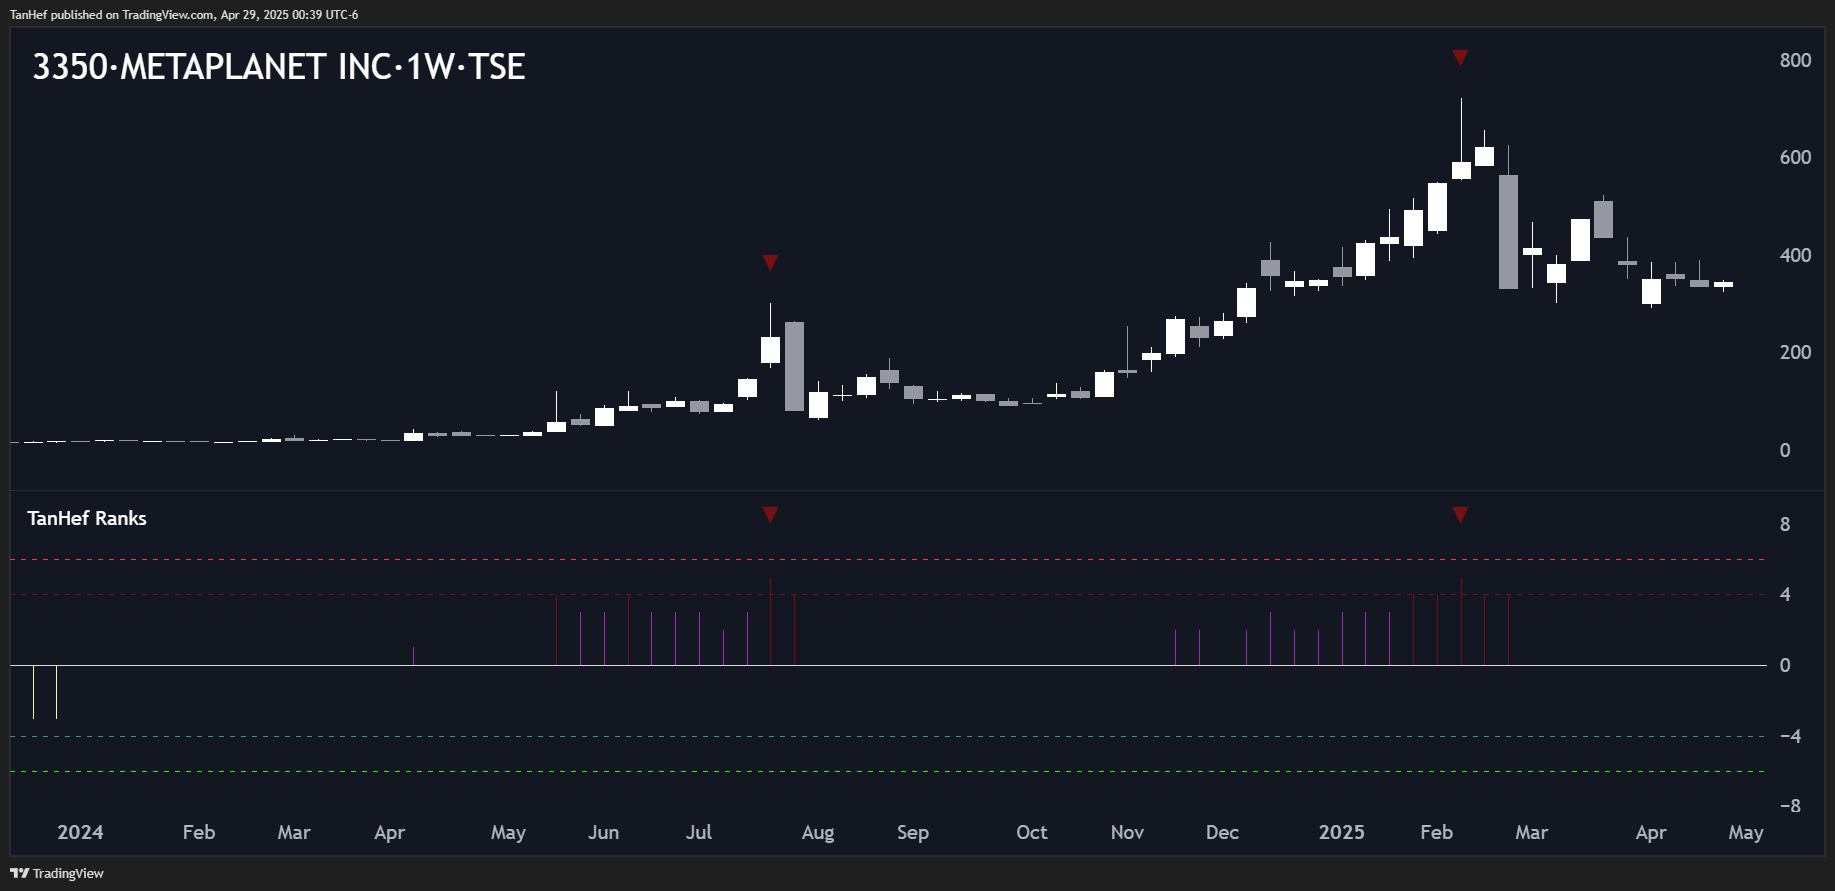
2025 Top (-60%)
[Lack of data]
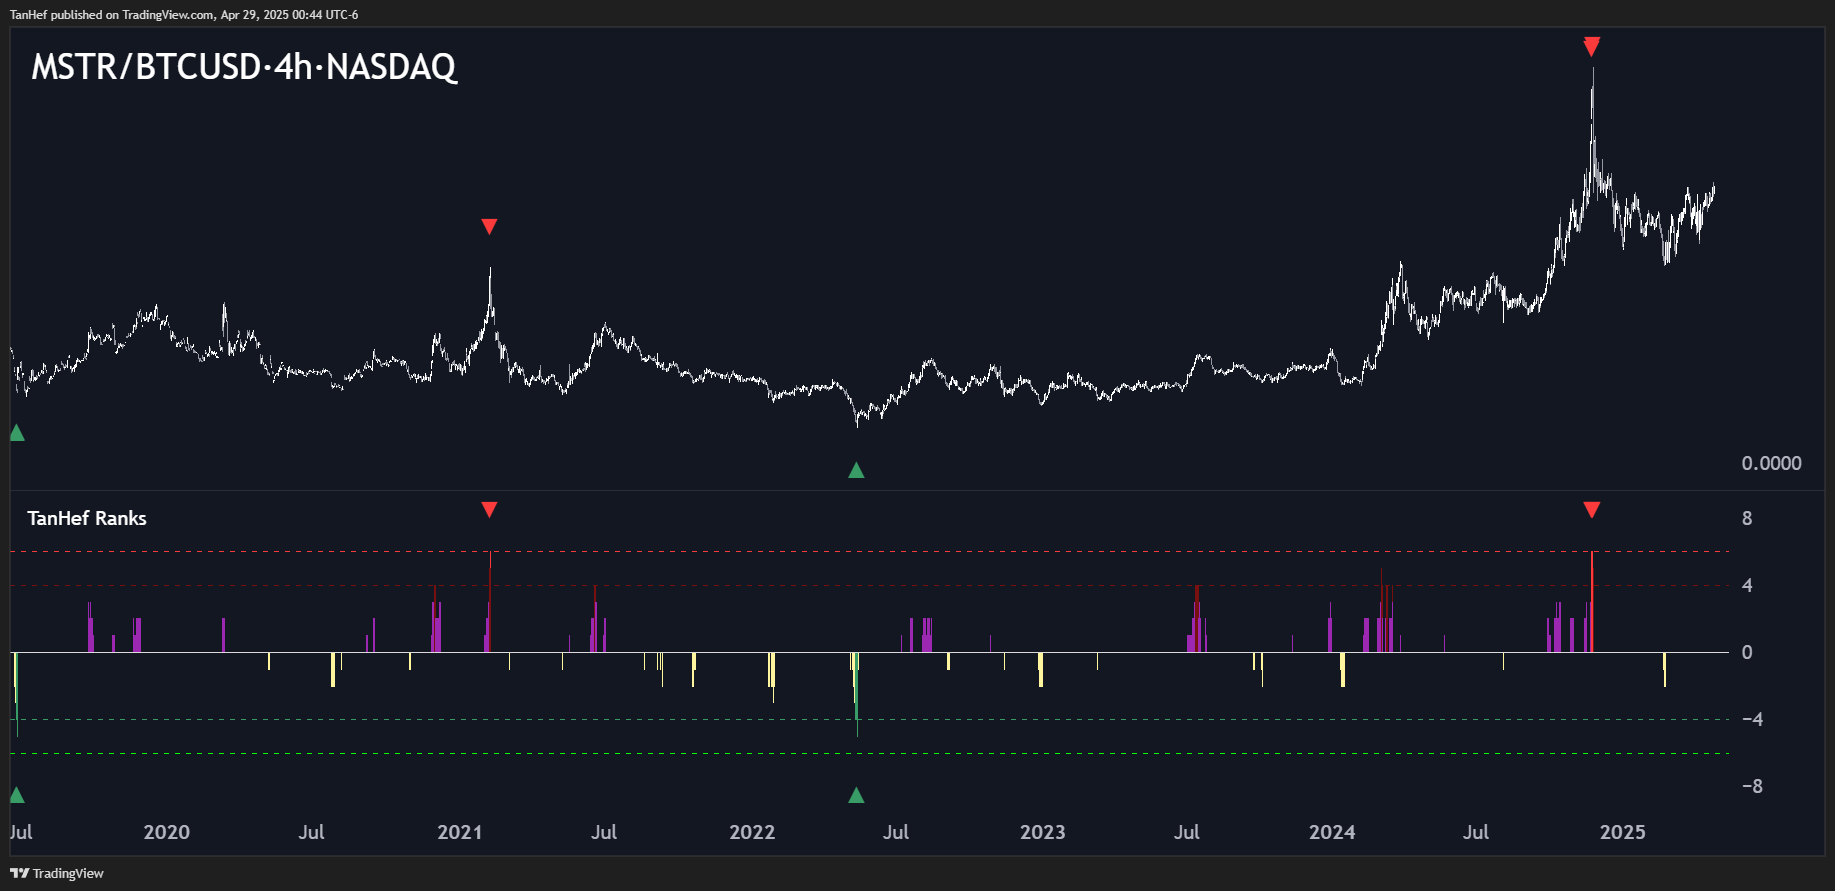
2021 ~High (-78%)
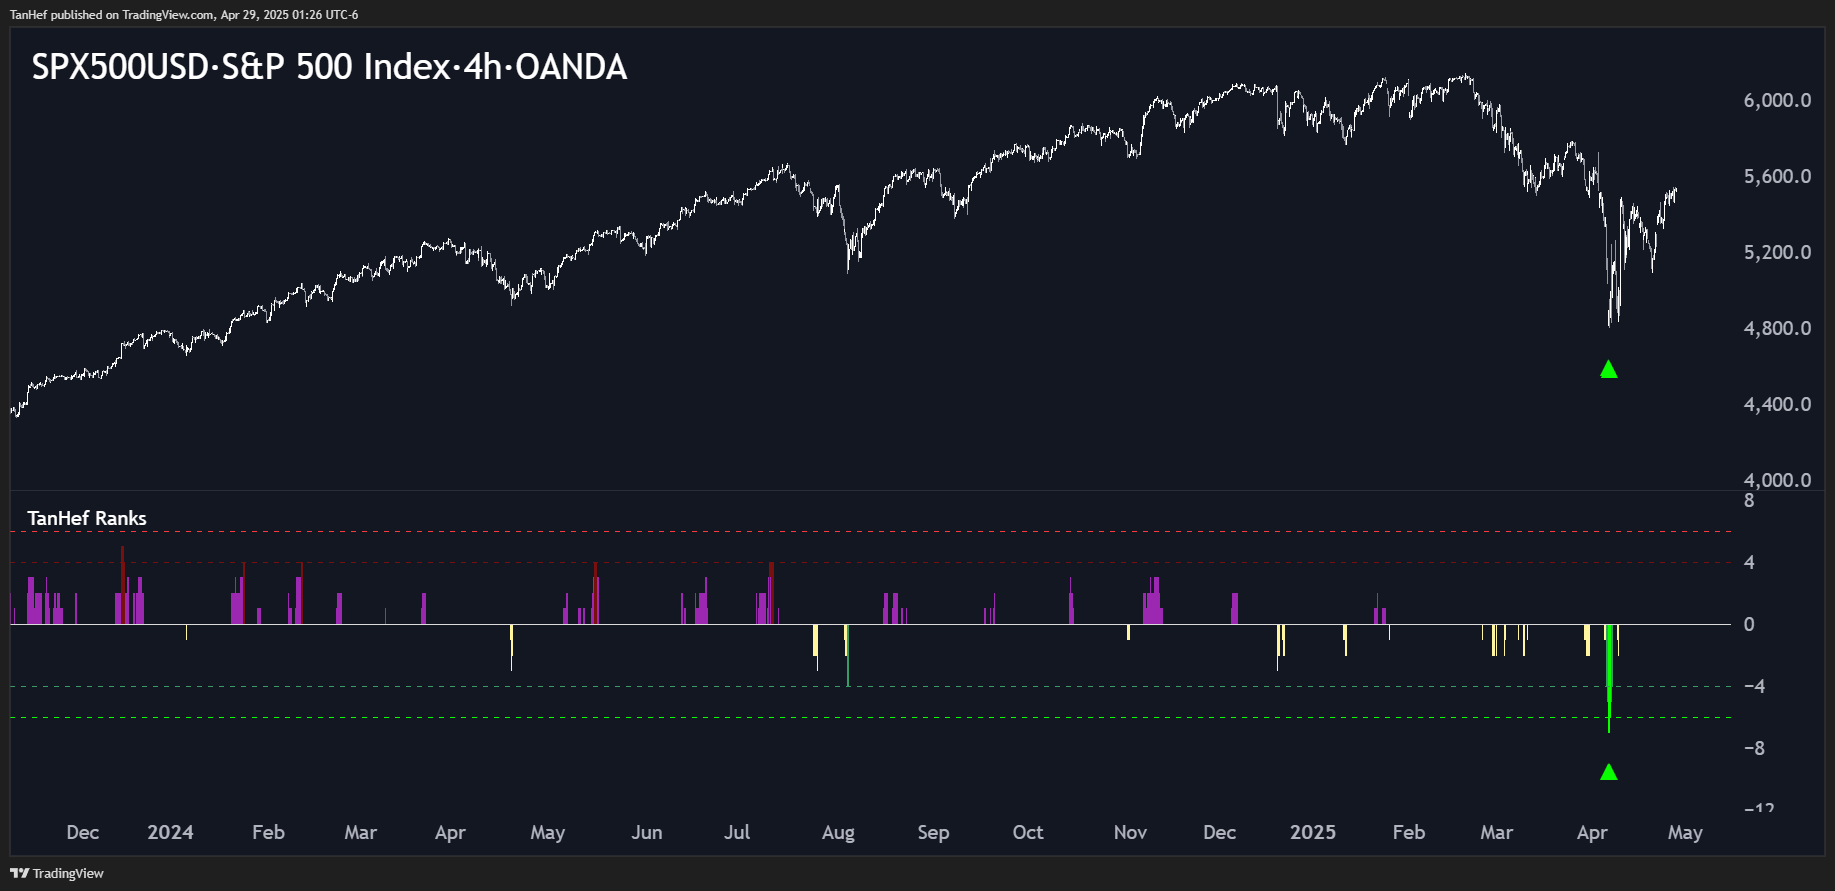
2025 ~Low
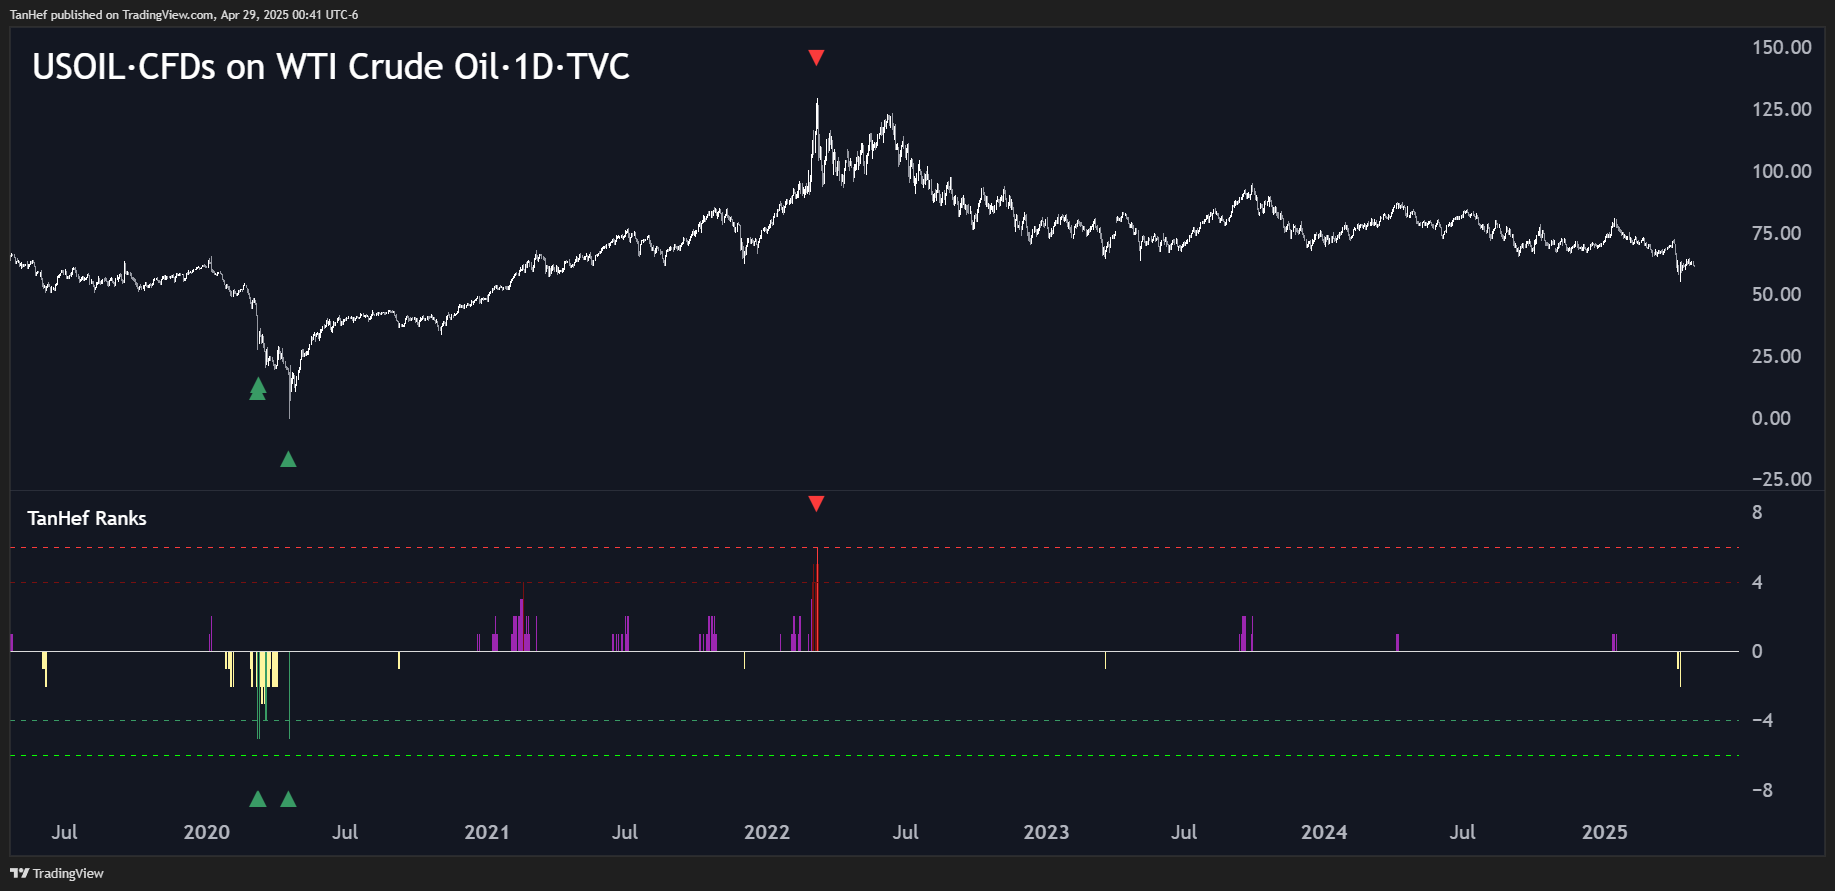
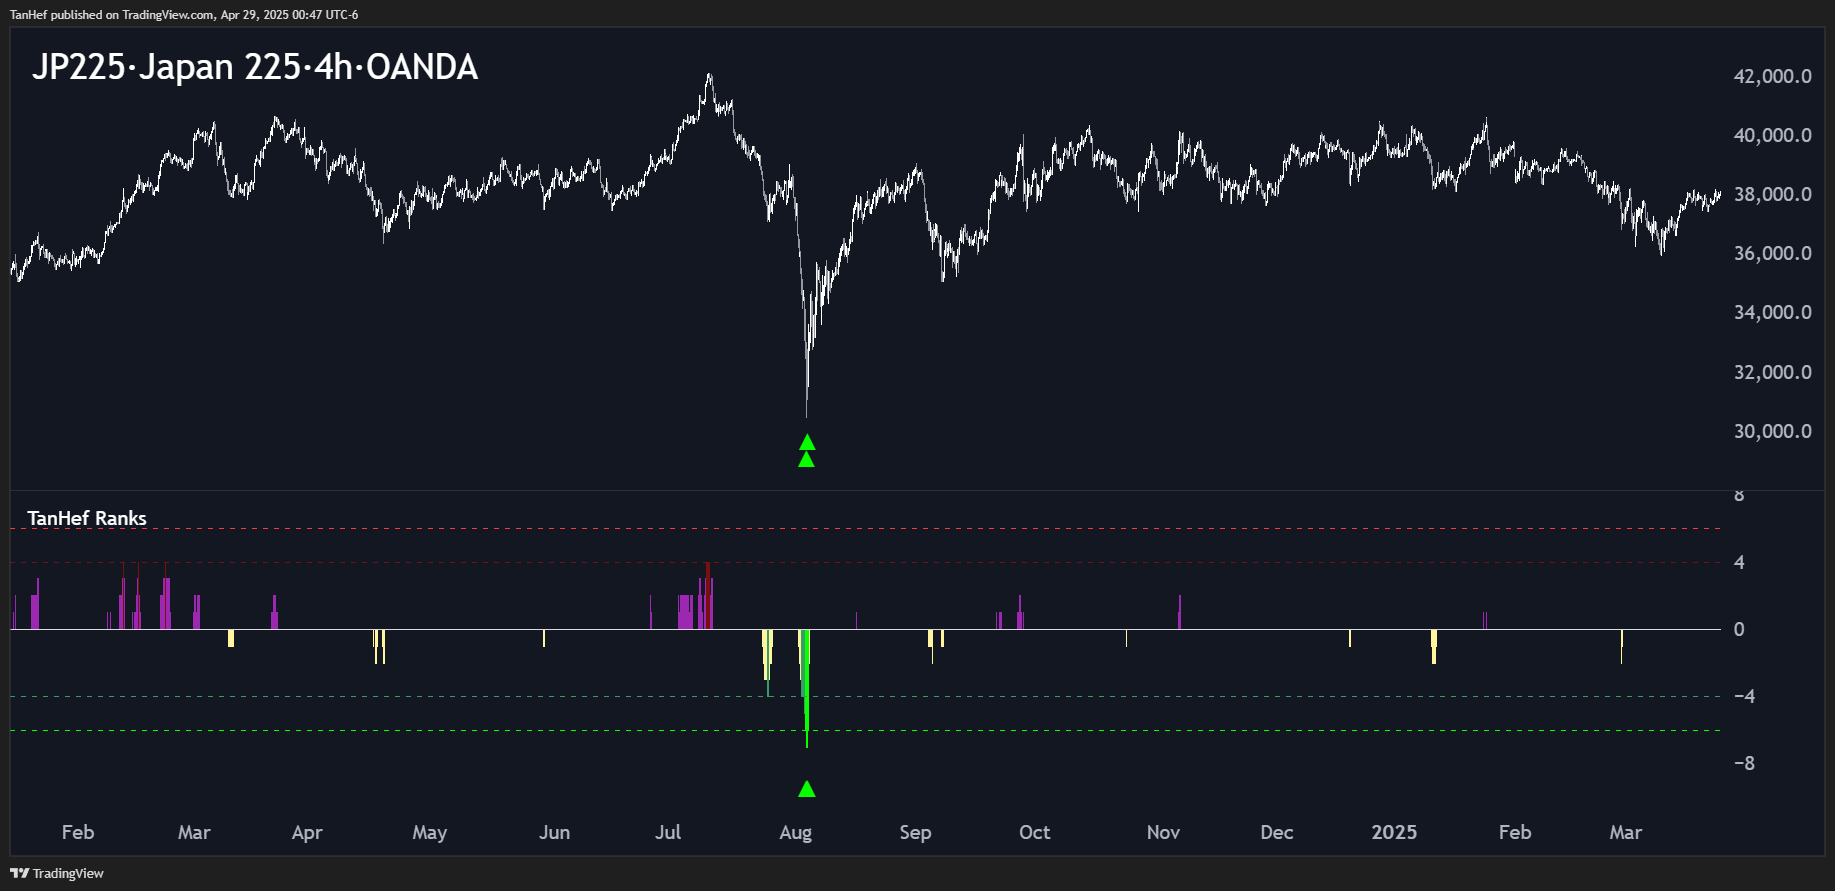
[Demand Shock]
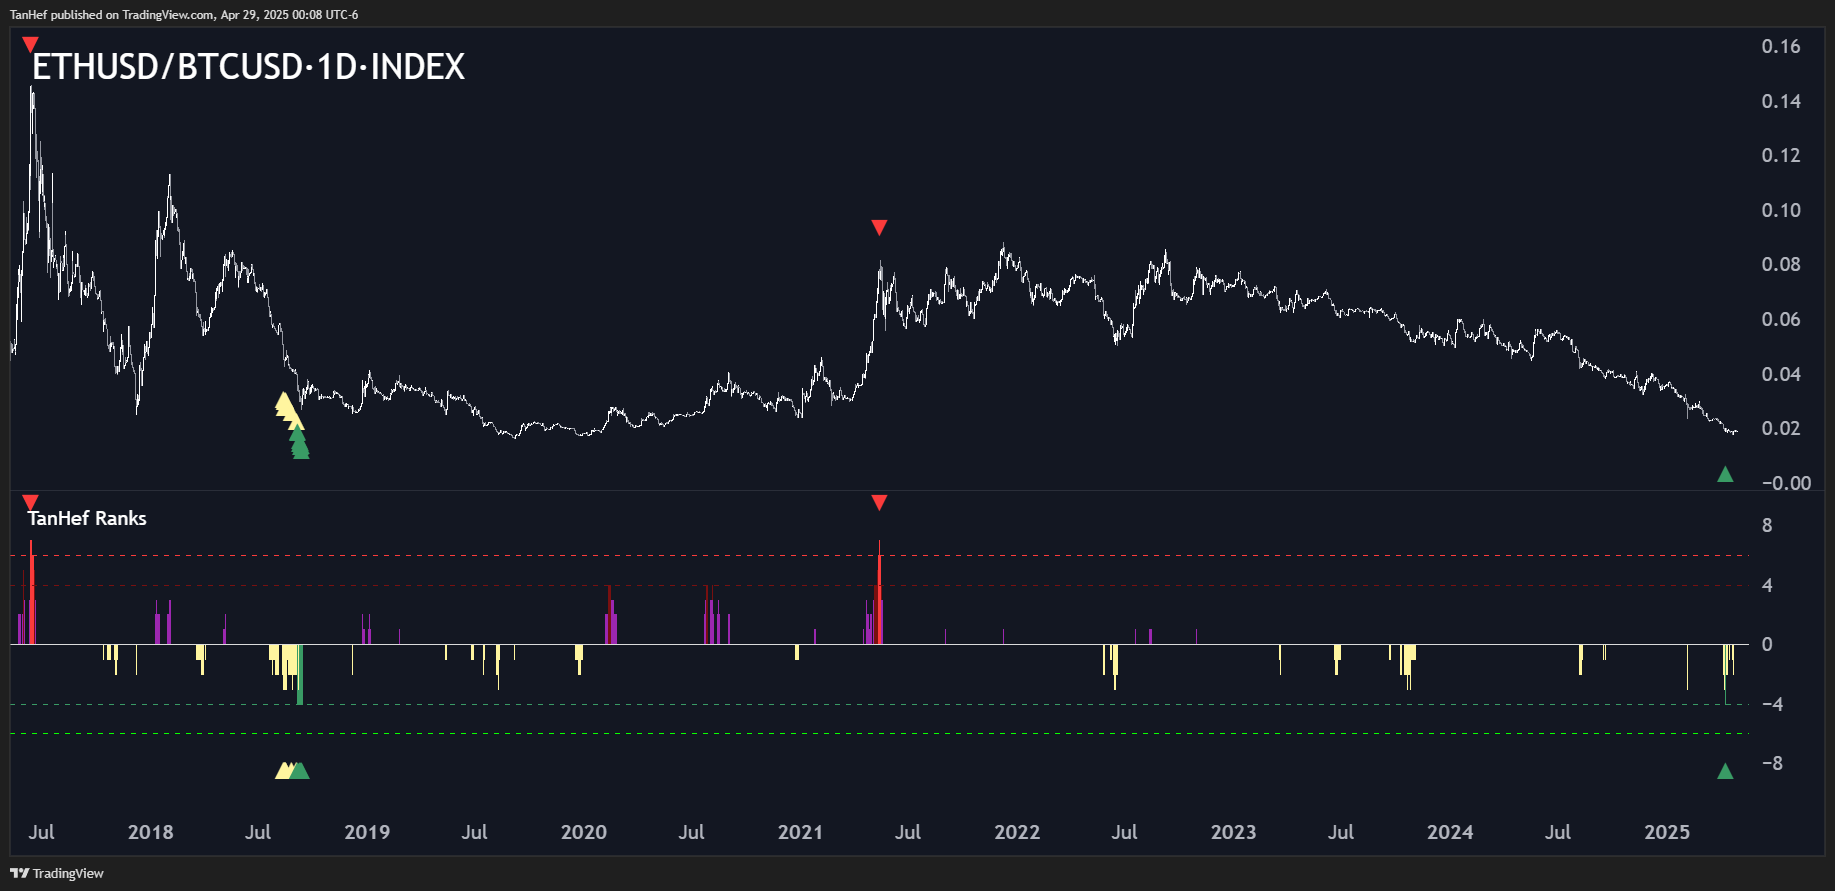
2022 High (-57%)
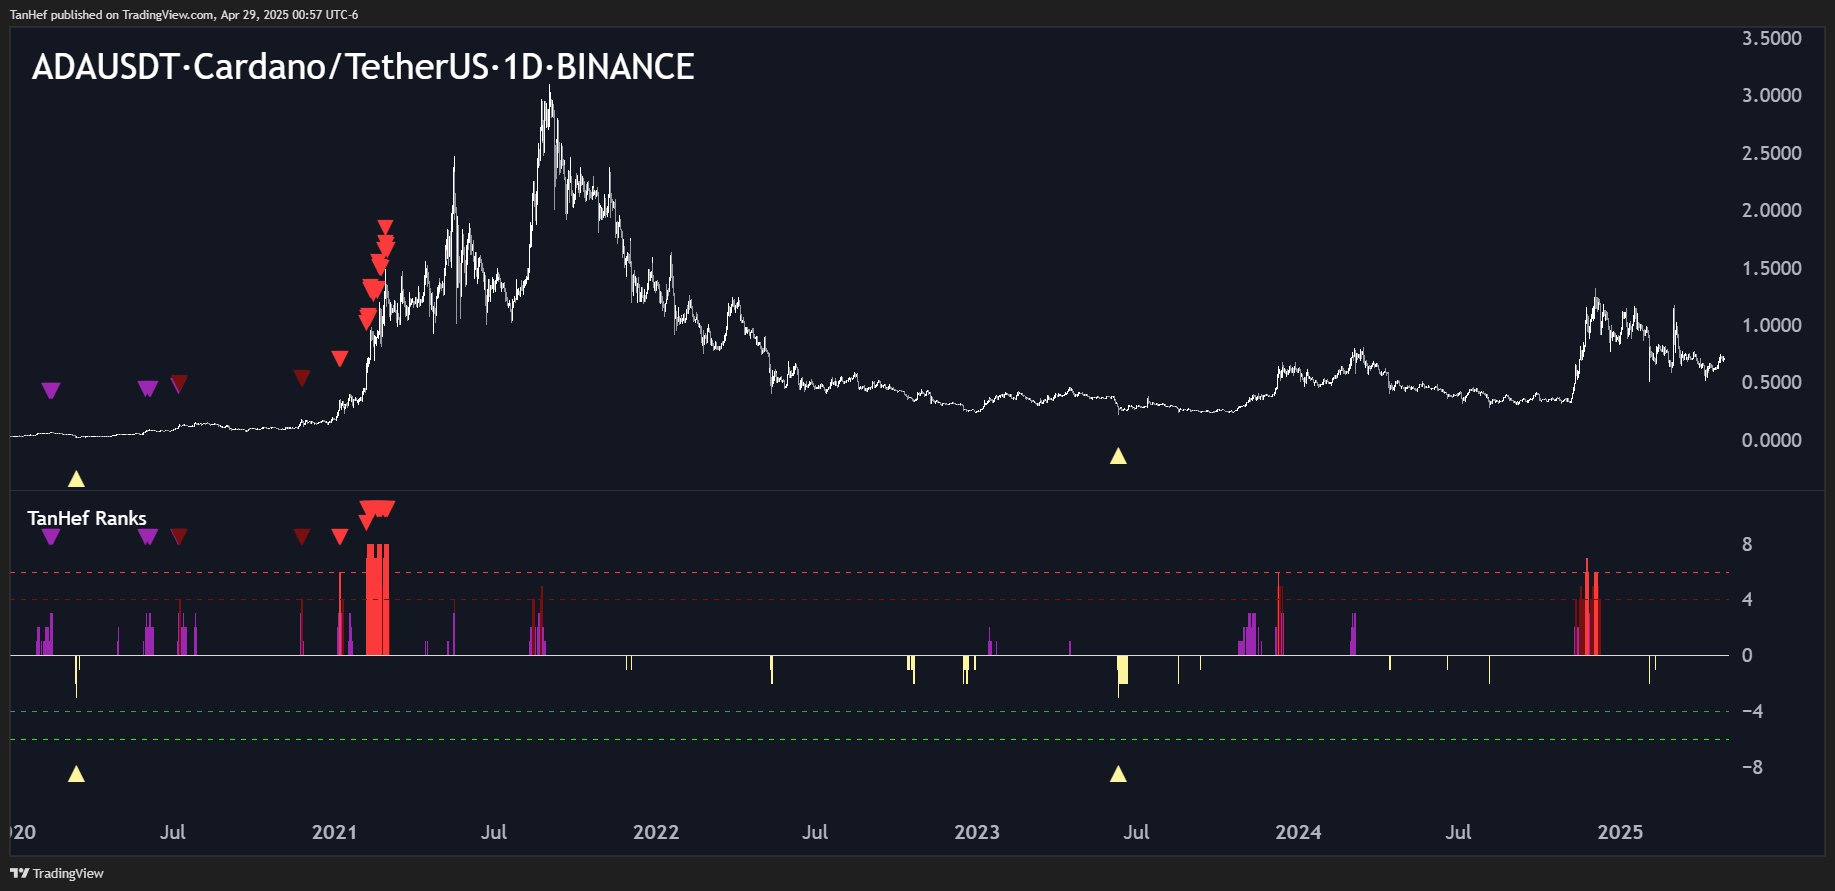
2021 High (Missed) [FOMO = less effective]
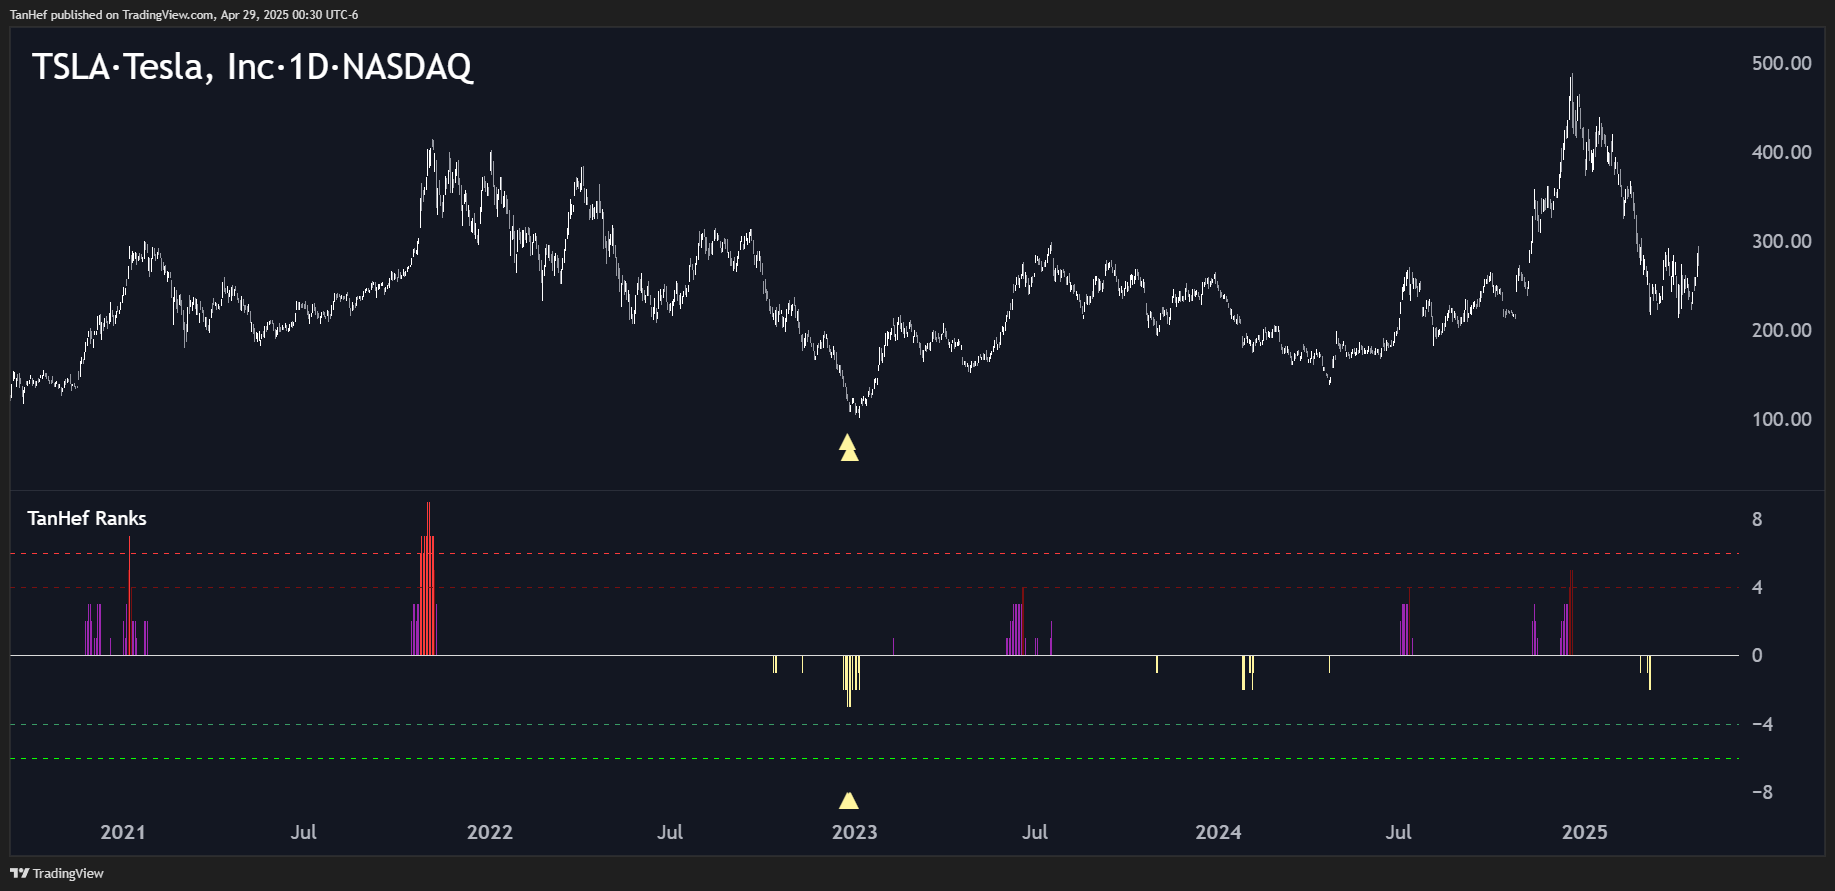
2023 Low (+500%)
Tutorial
TanHef Ranks helps you stay patient, avoid bad trades, and make decisions when it counts — get alerts instead of staring at charts.
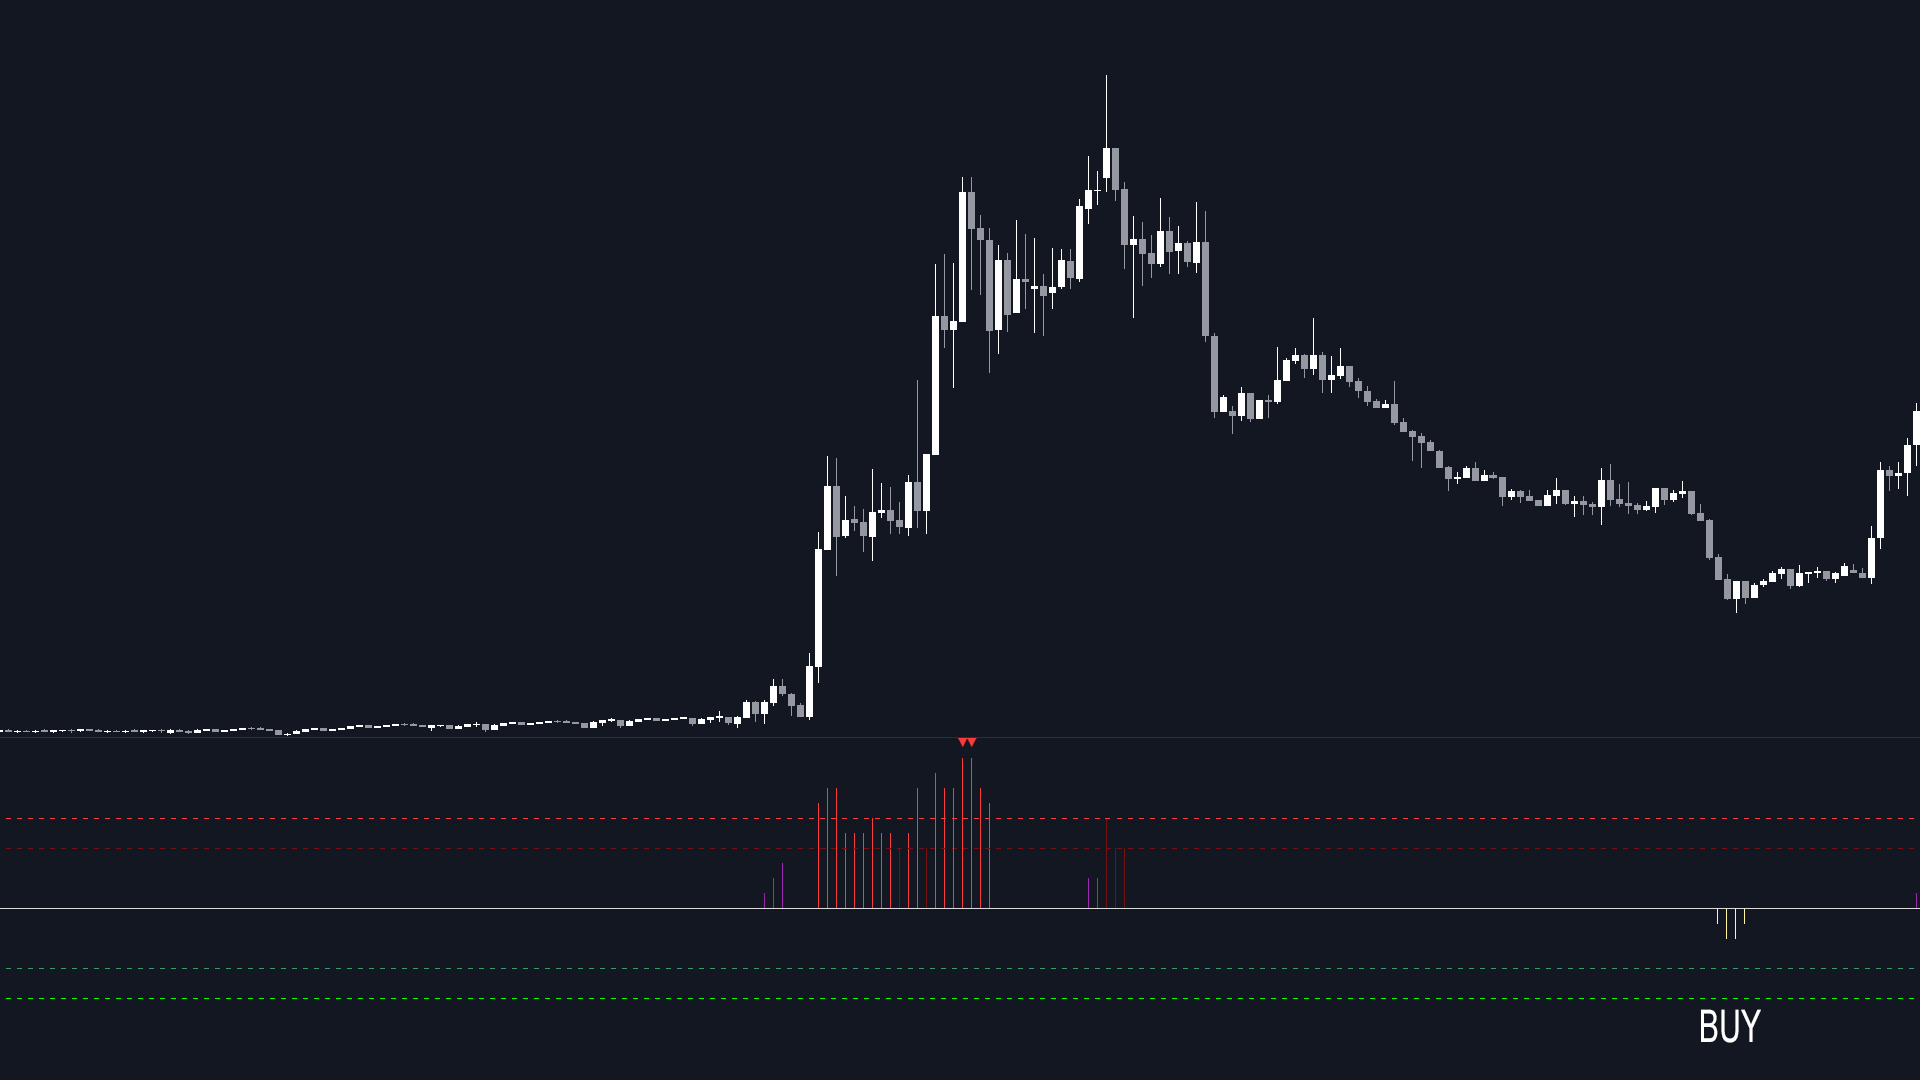
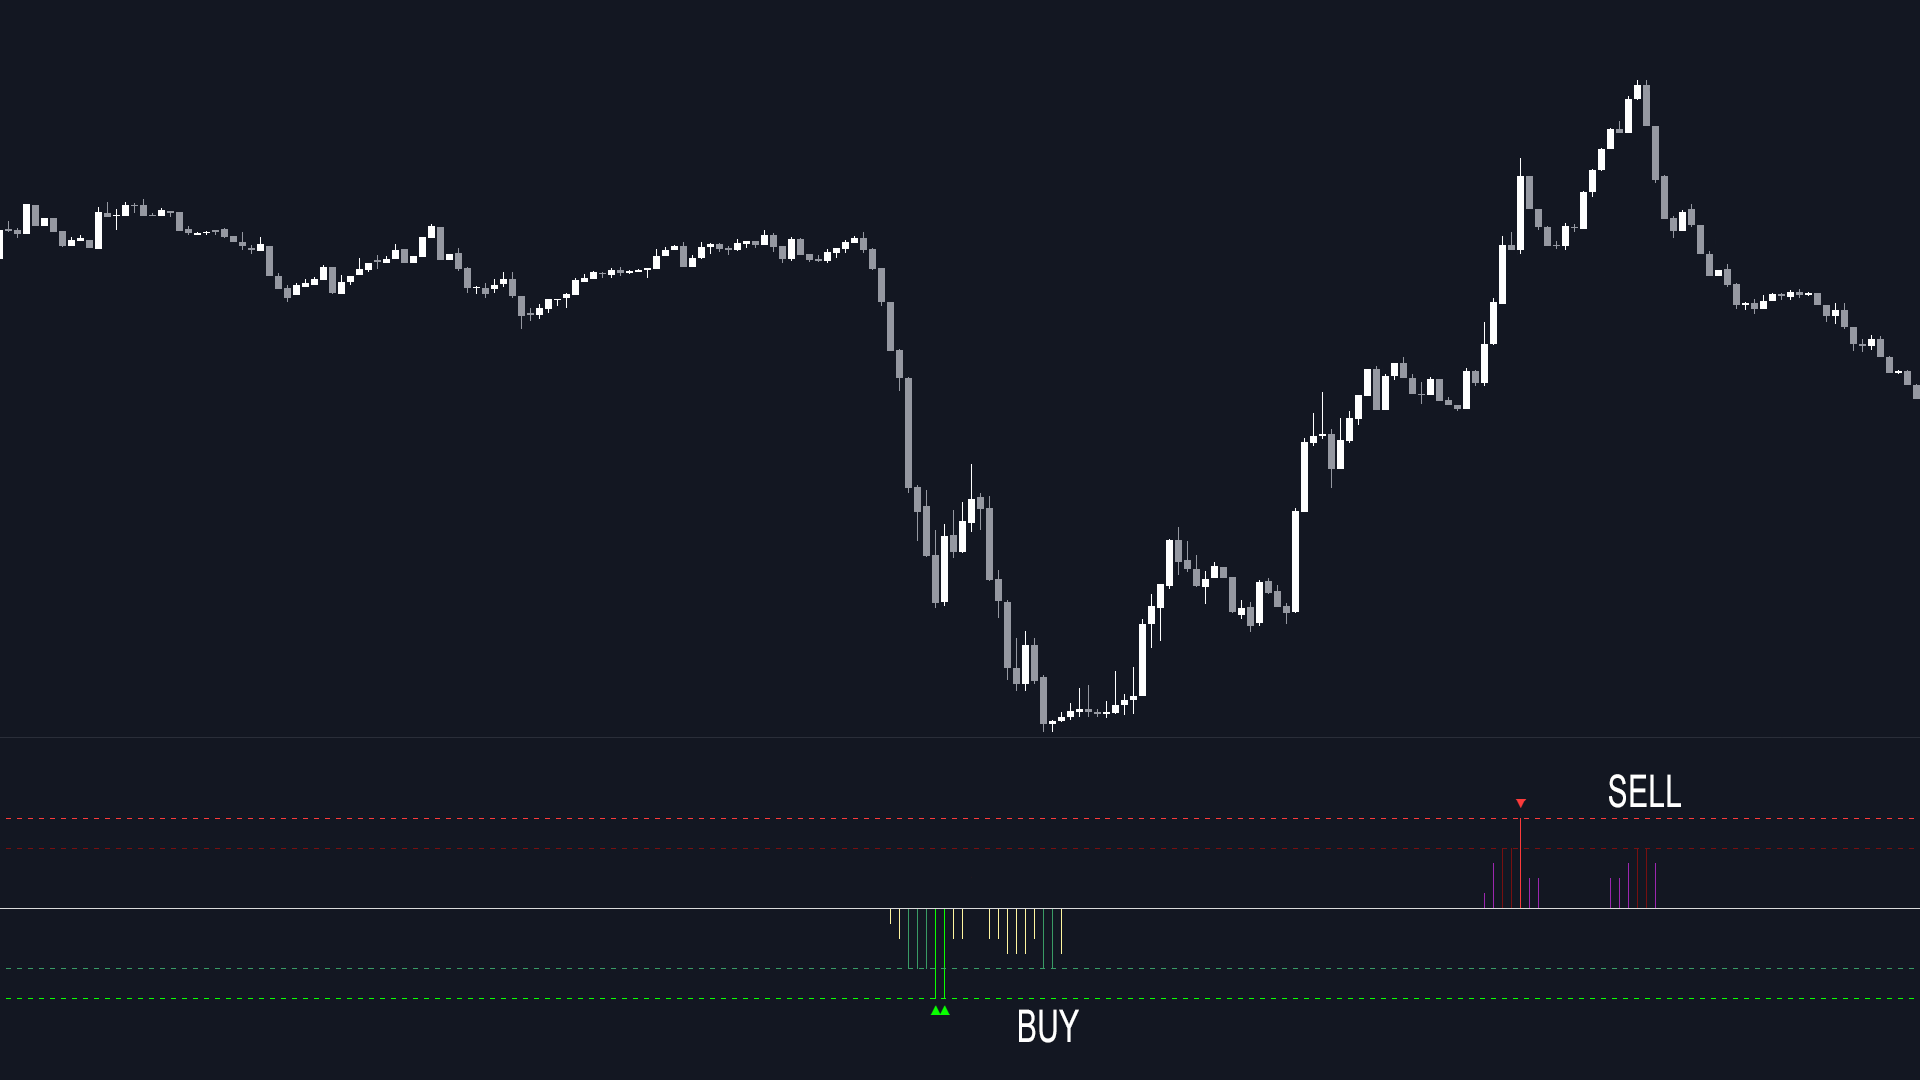
Quick-Start: Extreme Oversold (▲=Buy). Extreme Overbought (▼=Sell).ⓘ
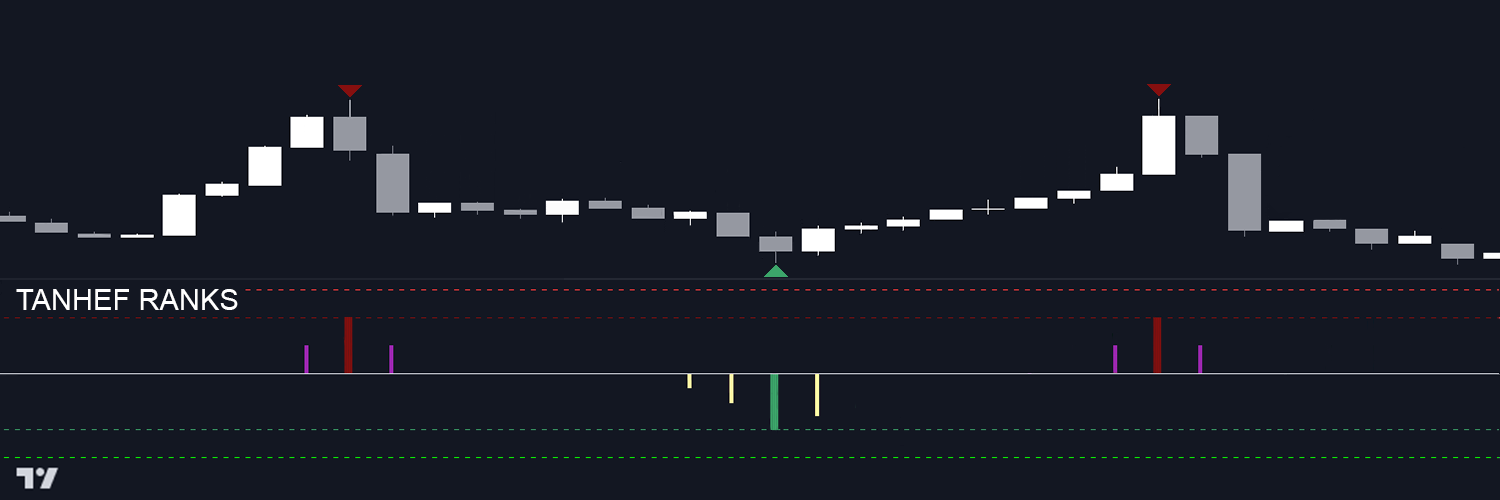

TanHef Ranks indicator — simple trading signals using ranks.
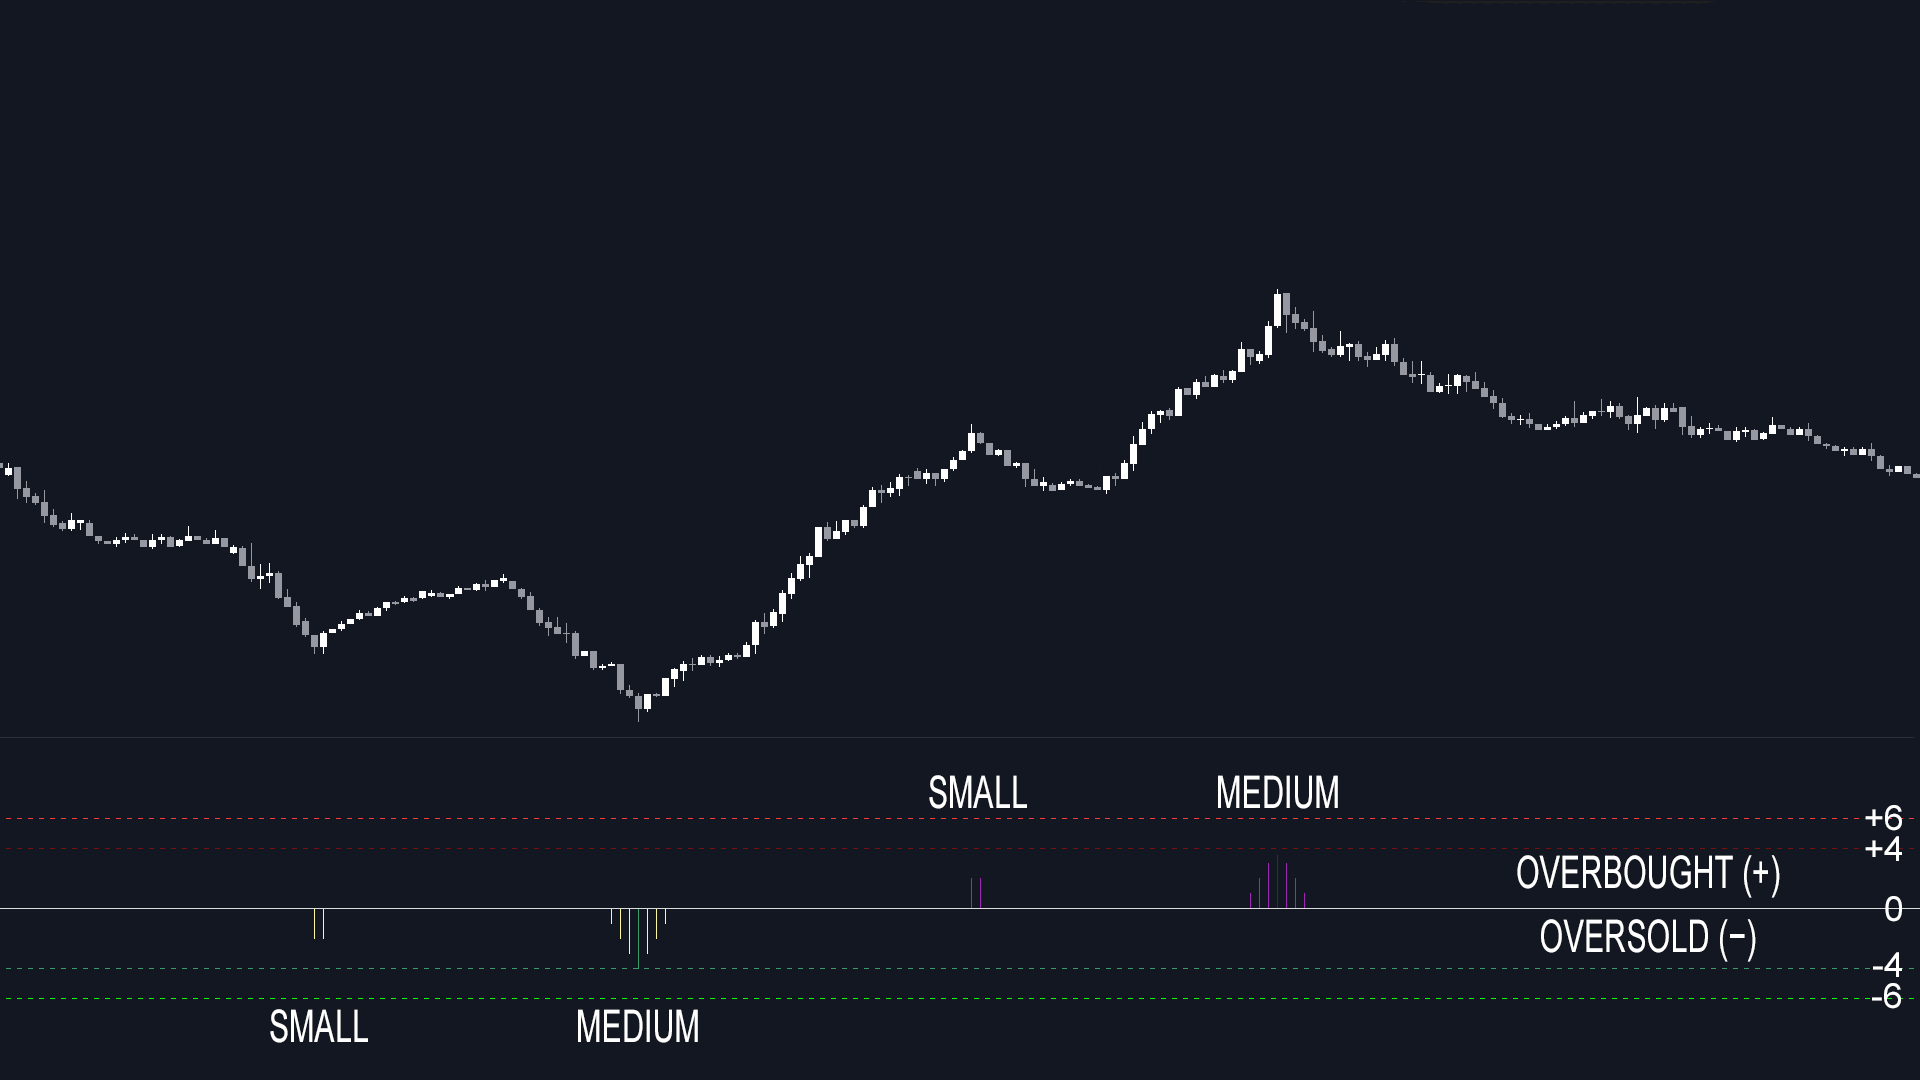
Small (+⁄- 1,2,3): short-term reversal.
Medium (+⁄- 4,5): mid-term reversal.
Large (+⁄- 6,7,...18): long-term reversal.
Positive (Overbought): potential top.
Negative (Oversold): potential bottom.
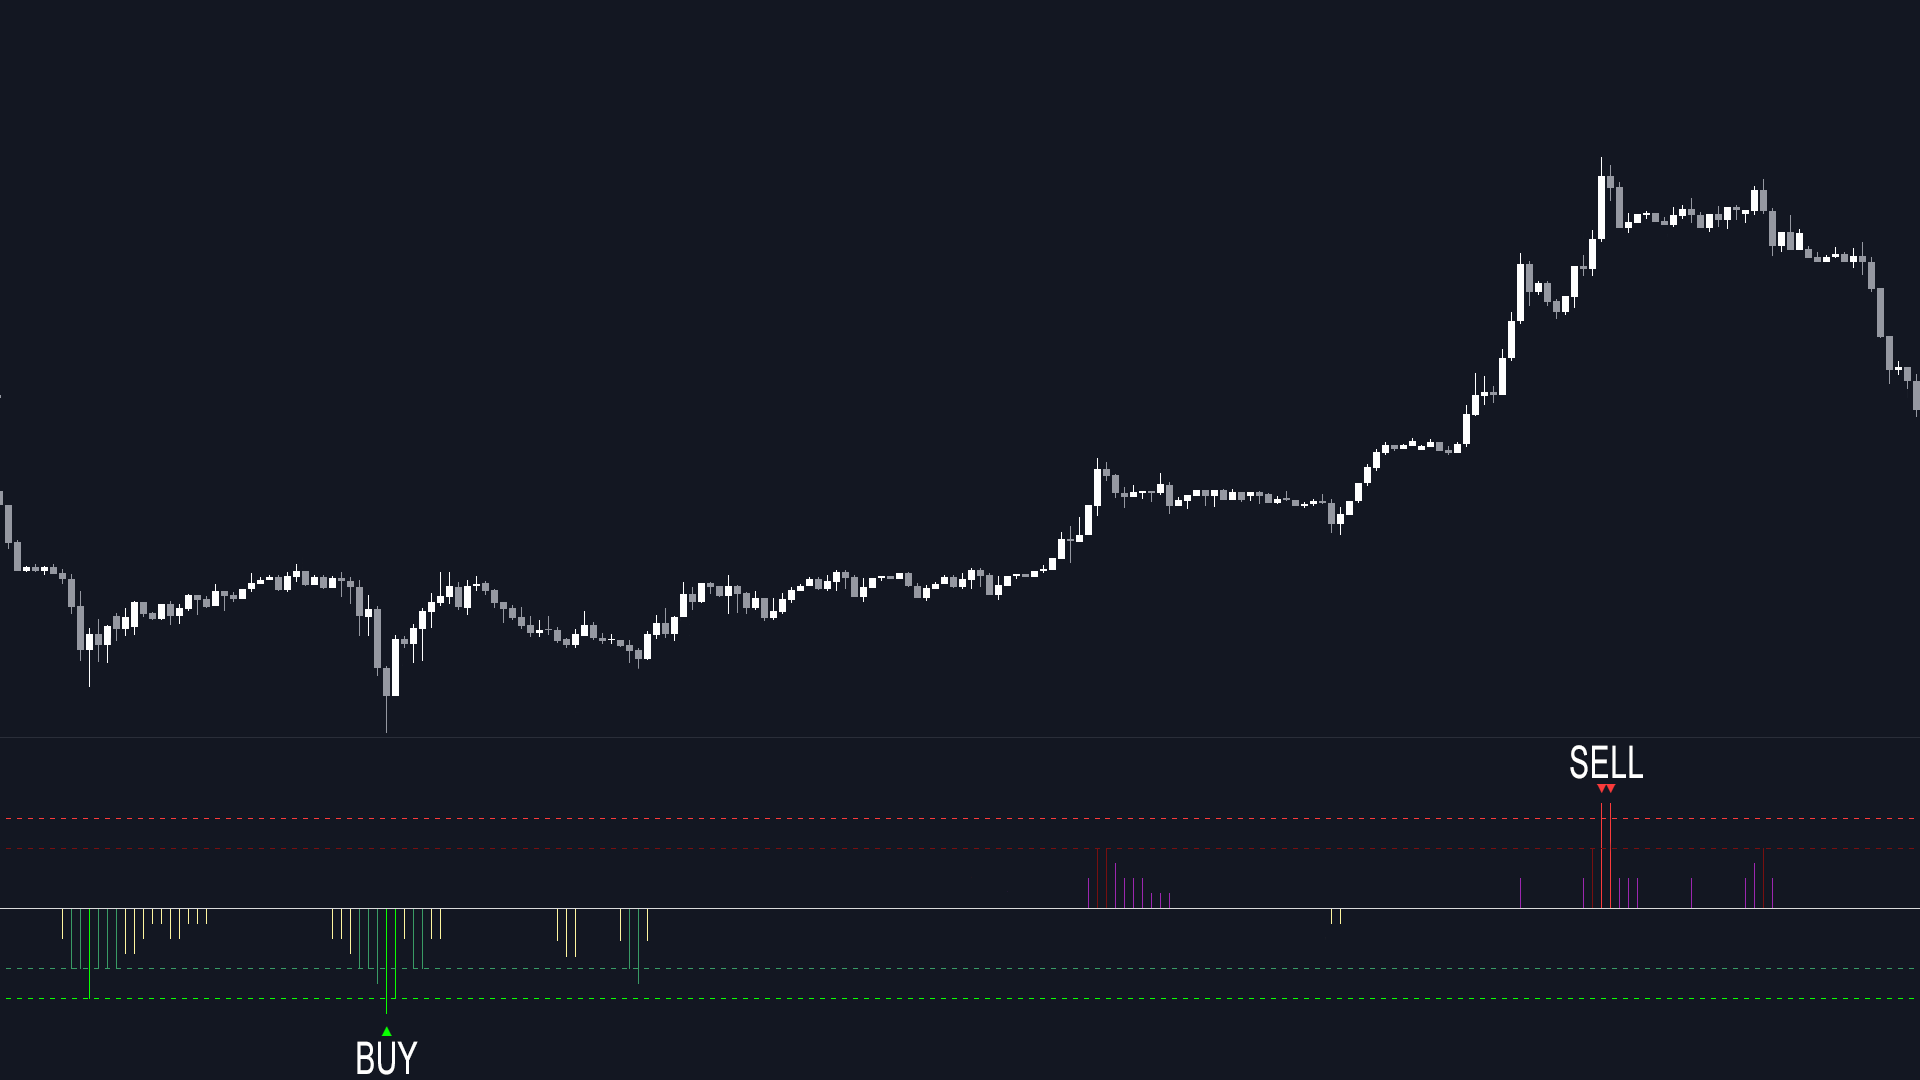
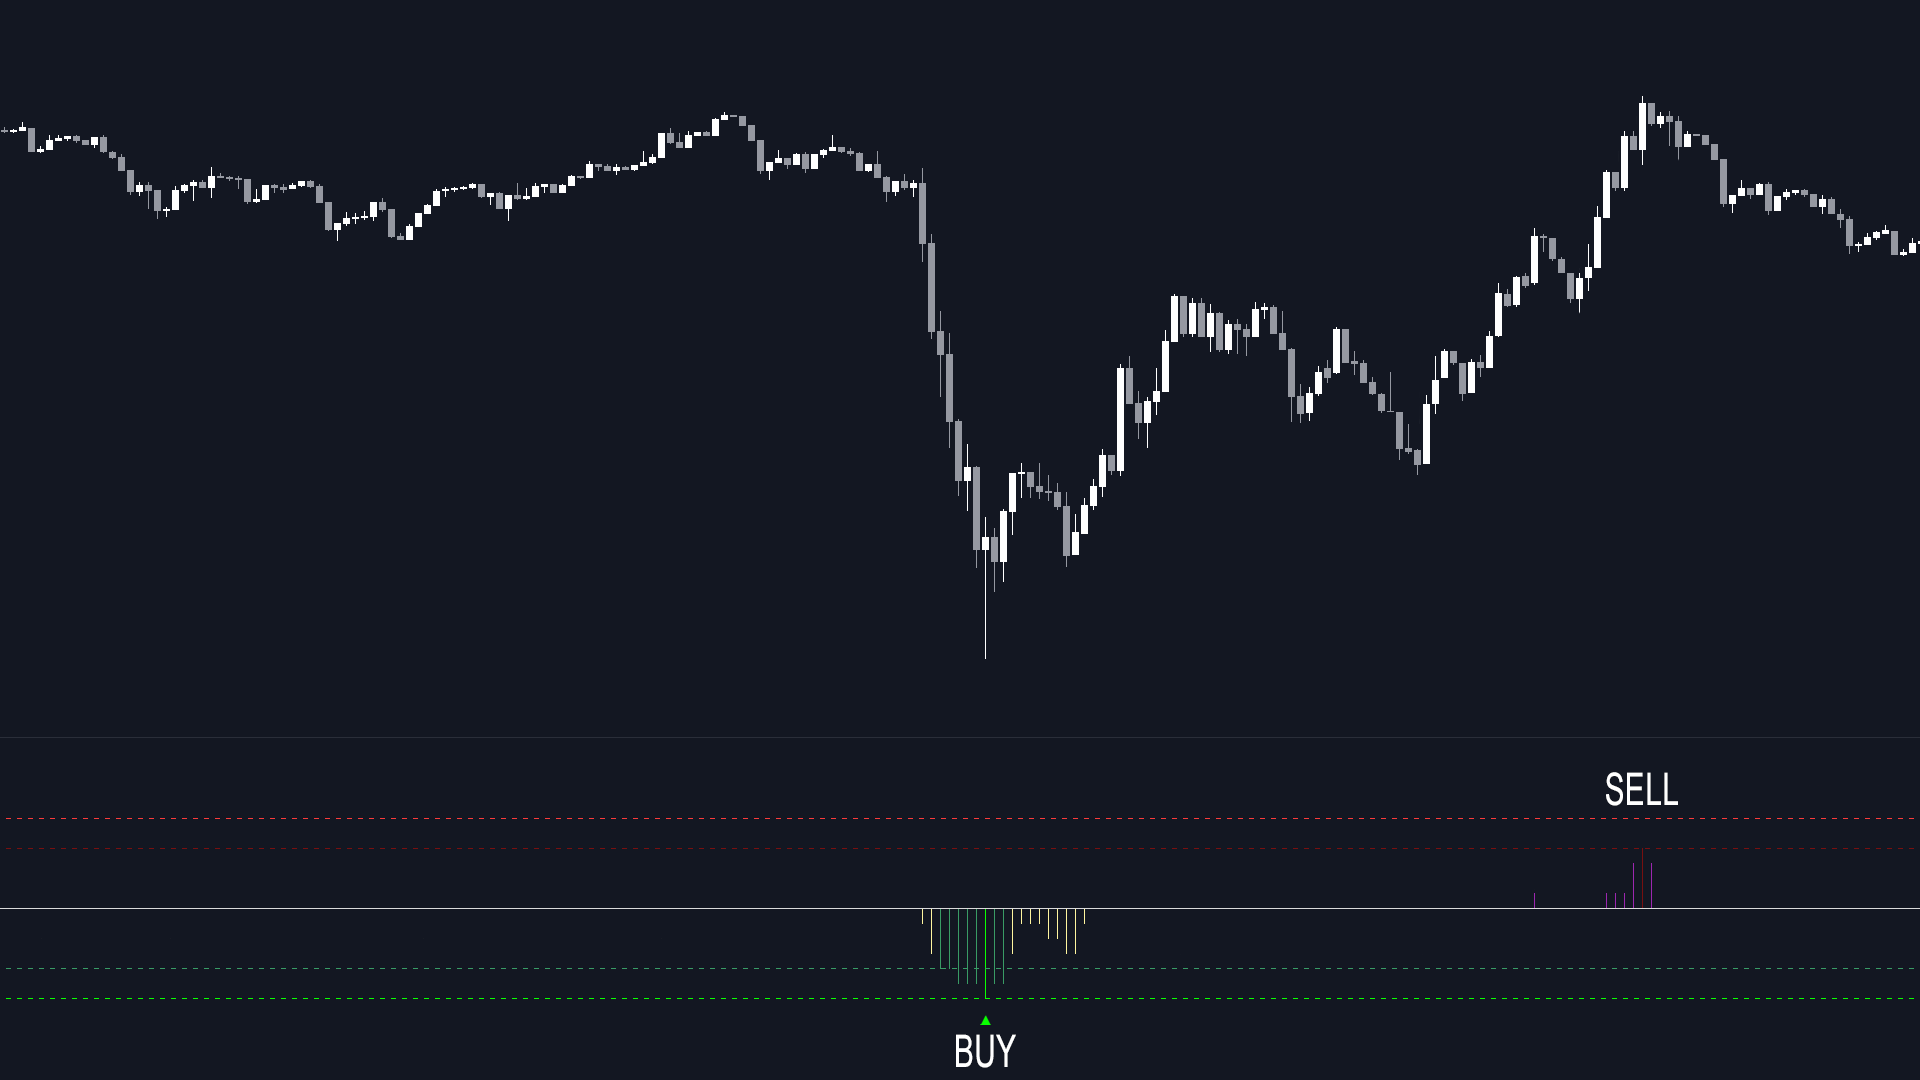
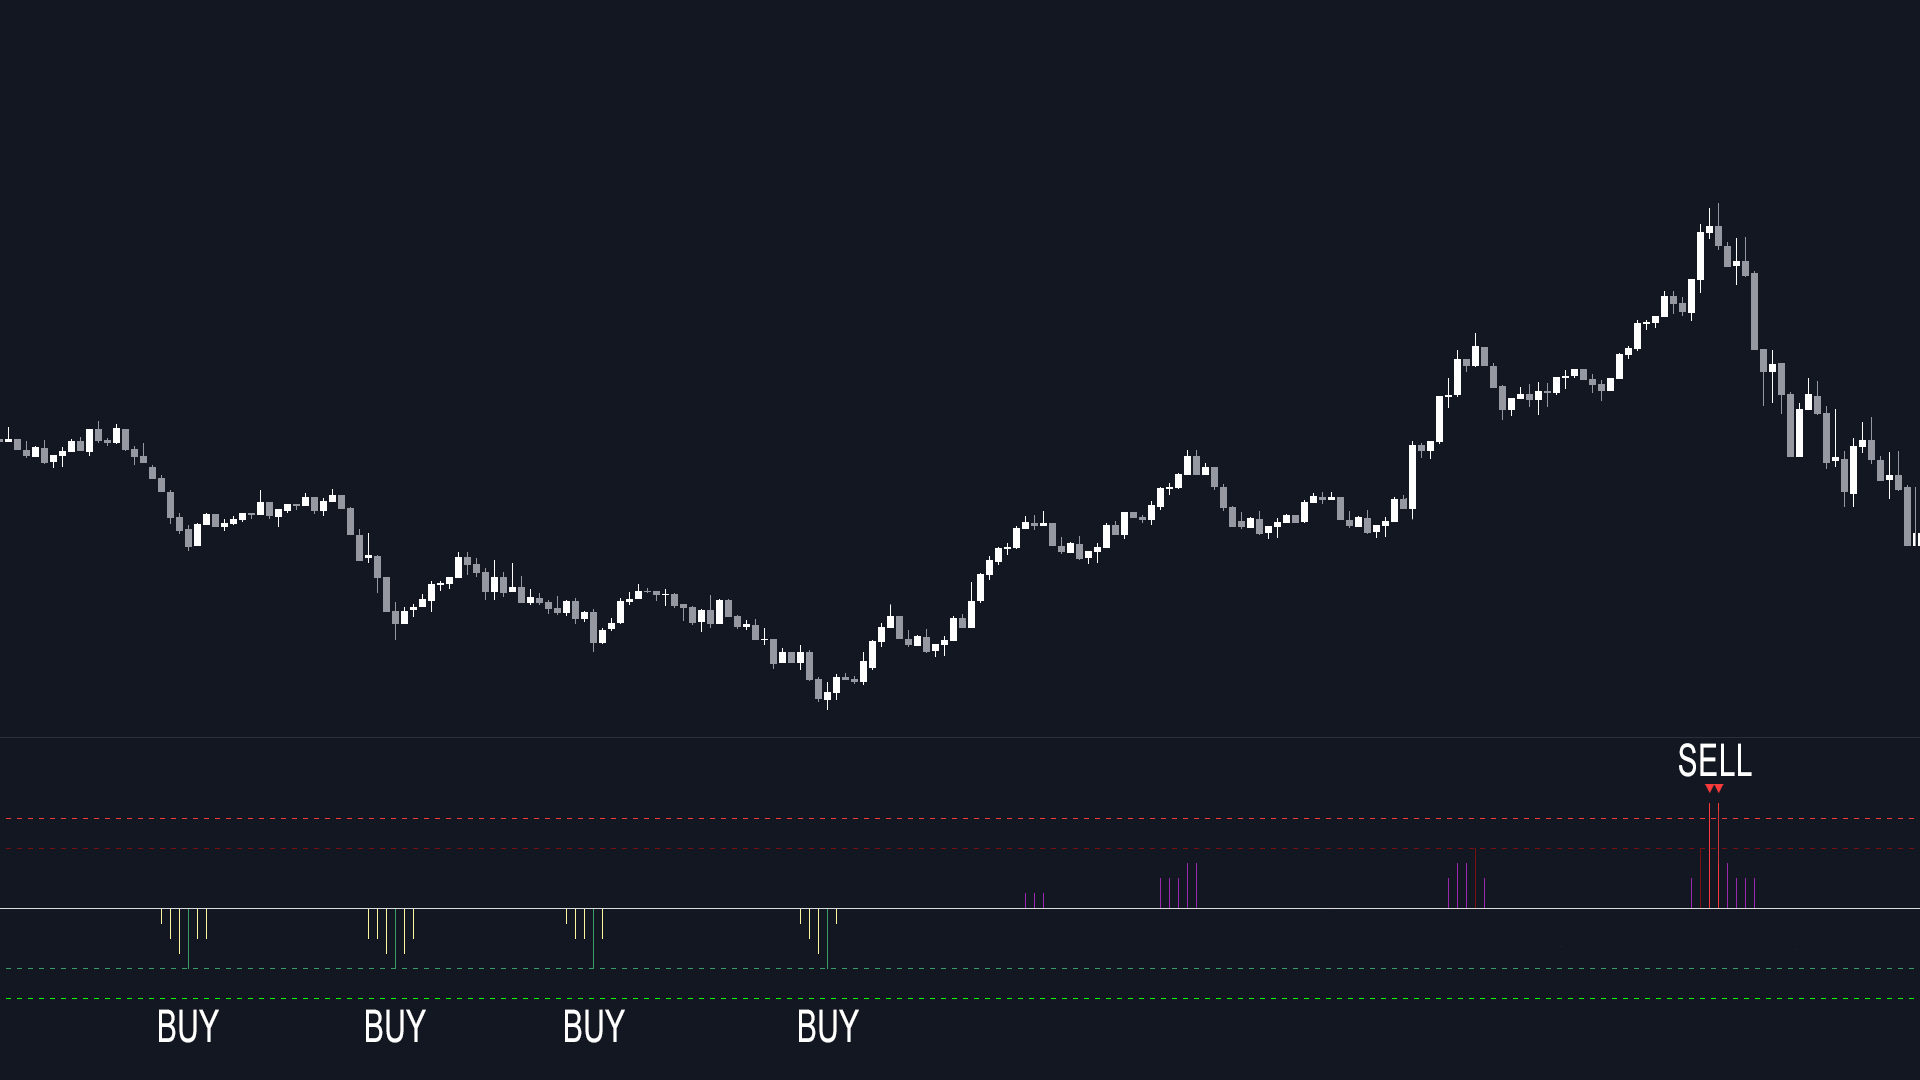
Buy: most extreme oversold (▲).
Sell: most extreme overbought (▼).
▲/▼ mark most extreme ranks to date.
Extremes reference all historical bars.
Backtest extremes best with bar-replay.
Buy: large oversold rank.
Sell: small/medium overbought rank.
Patient entries.
Aggressive profit taking.
Less unproductive time holding.
Buy: small/medium oversold ranks.
Sell: large overbought rank.
Dollar Cost Average (DCA) cheap.
Sell or skip DCAs when expensive.
Buy: small oversold ranks.
Sell: small overbought ranks.
Prevents buying tops or selling bottoms.
Wait for a small rank to limit/prevent loss.
Larger ranks are still usually best.
How to spot a divergence:
• Signal less than prior signal.
• Price more extreme than prior.
• Try my TradingView indicator
'Divergence Cheat Sheet'.
Divergences tell us:
• Momentum is slowing.
• Price is overextended.
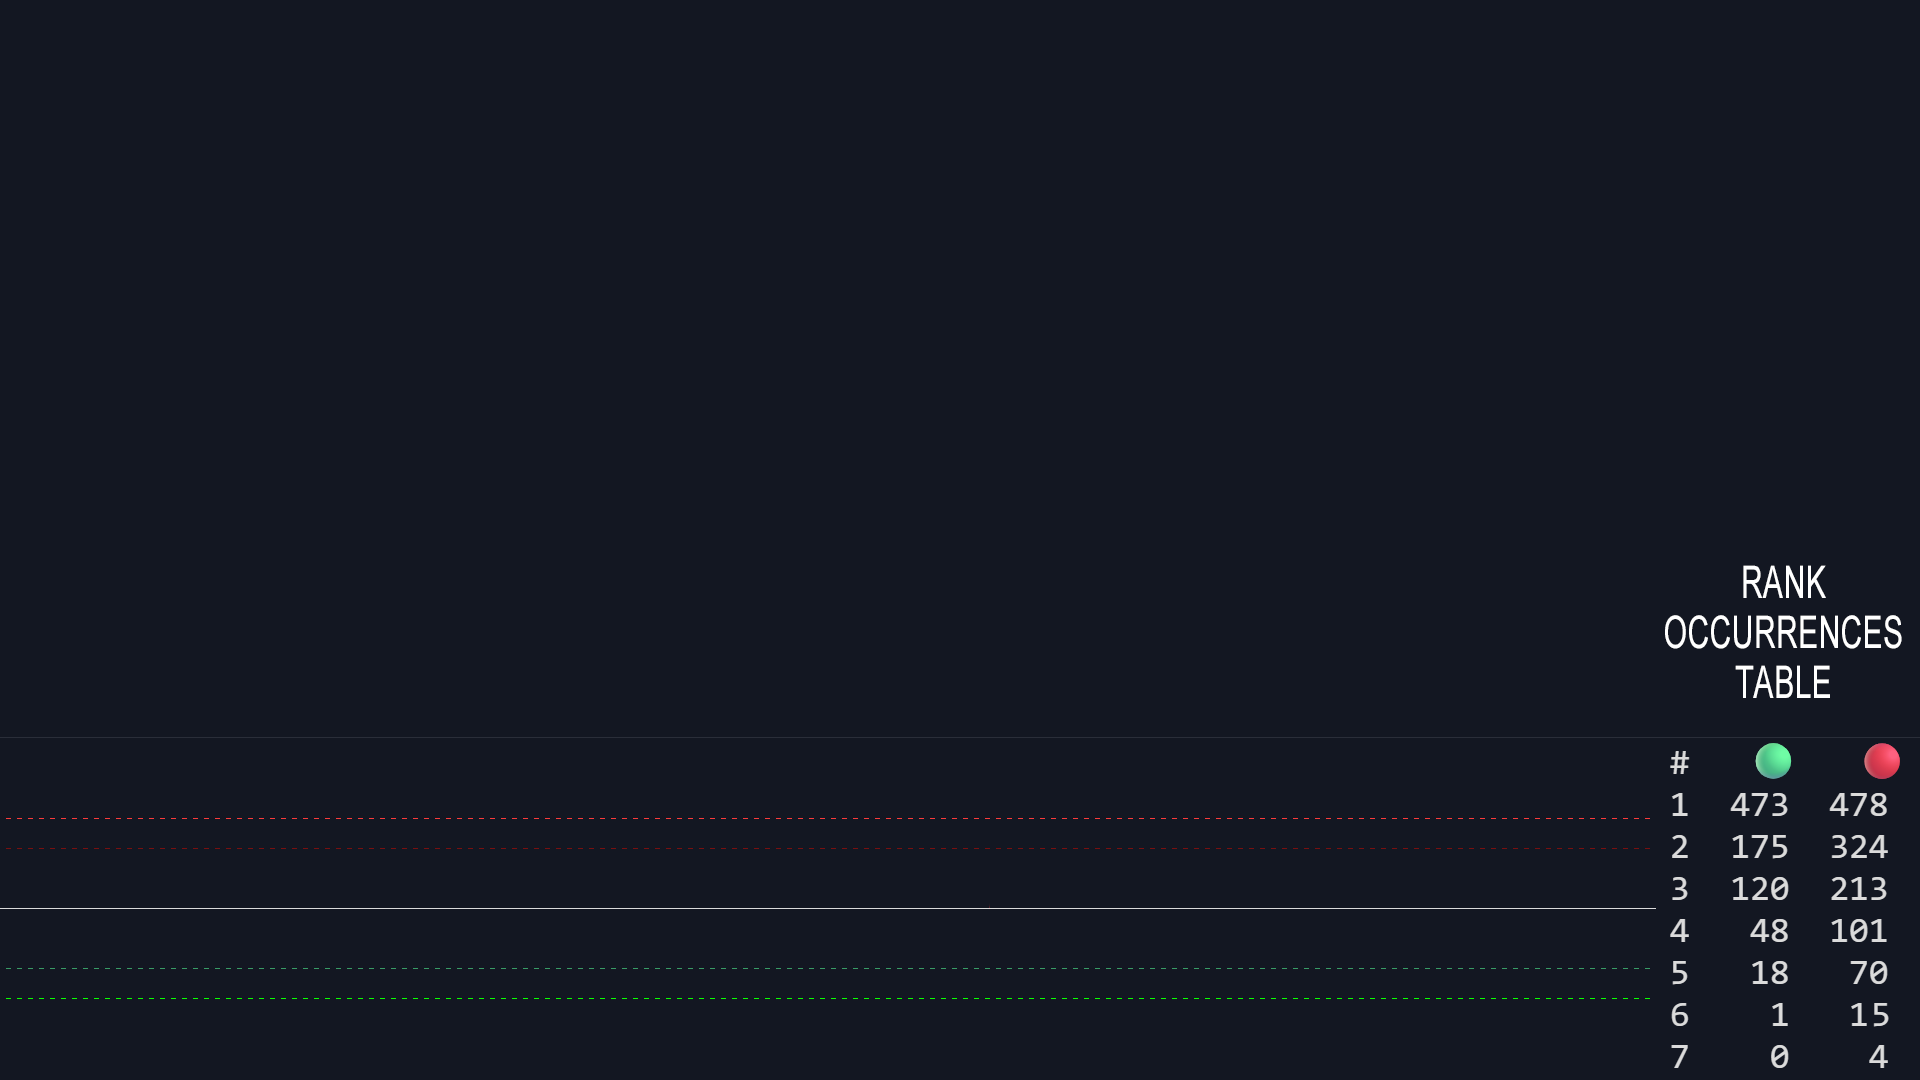
1) Check ‘Rank Occurrences’ table.
• Best Buy: −6🟢 (extreme/largest oversold).
• Best Sell: +7🔴 (extreme/largest overbought).
• New-extremes more effective (−7🟢,+8🔴).
• Near-extremes useful too (−5🟢,+6🔴).
2) Review price action at prior ranks.
• −5🟢 as proxy. −6🟢 occurred once.
• +7🔴, occurred four times.
3) Analyze multiple timeframes (1h,4h,..).
4) Confirm strong fundamentals & news.

Scan faster. Stack confluence. Set alerts.
• Multi-ticker rank scan in one view.
• Pair Analysis: one vs many tickers for a strong confluence signal.
• Group Analysis: combine tickers to spot trends & rotations.
TanHef Ranks Screener — scans ranks and advanced pair analysis.
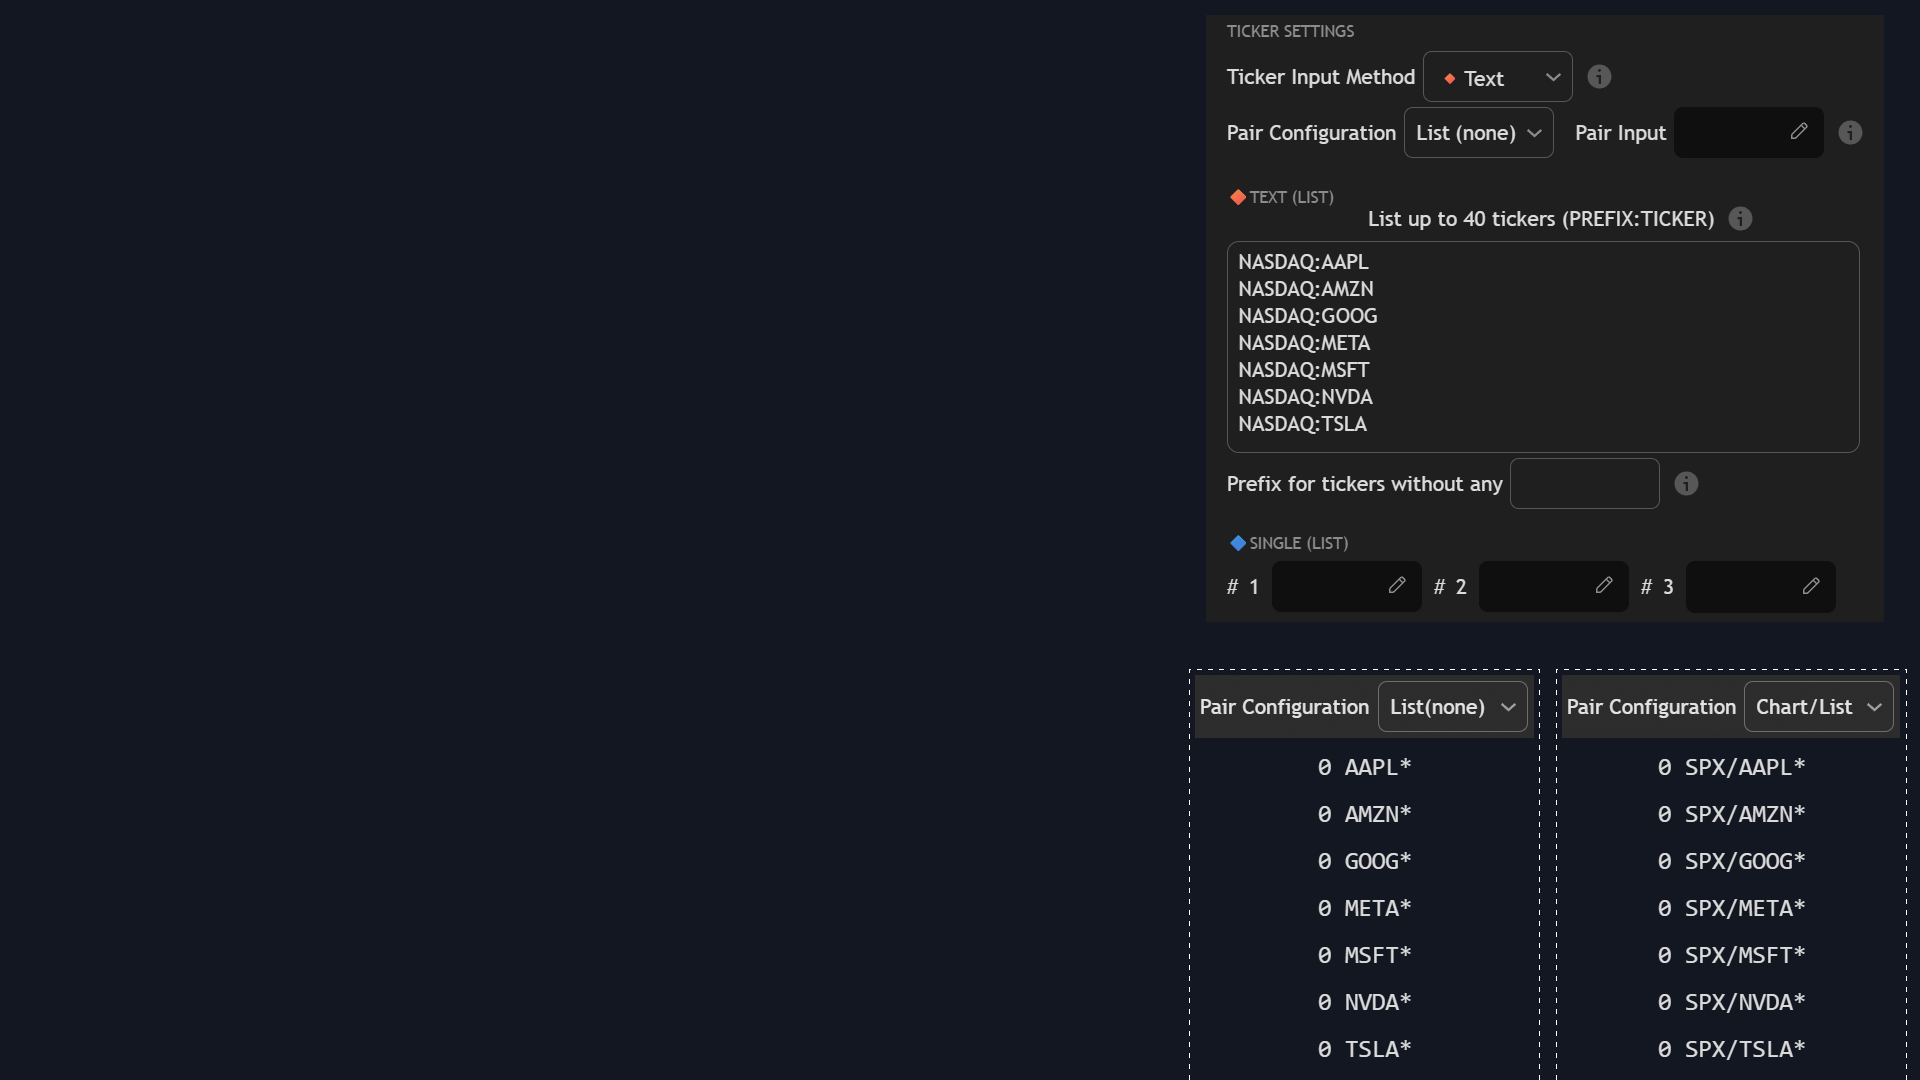
Ticker Input Method (◆Text and/or ◆Single)
• ◆Text (list) — comma- or line-separated list.
◦ Use exchange prefix to avoid mismatch.
• ◆Single (list) — add symbols one-by-one.
Pair Configuration (List, Chart/List, Input/List)
• List — symbol as entered (no auto-pairing).
• Chart/List — chart’s symbol ÷ each listed.
◦ Chart = SPX; List = AAPL → SPX/AAPL.
• Input/List — input symbol ÷ each listed.
◦ Pair Input = SPX; List = AAPL → SPX/AAPL.
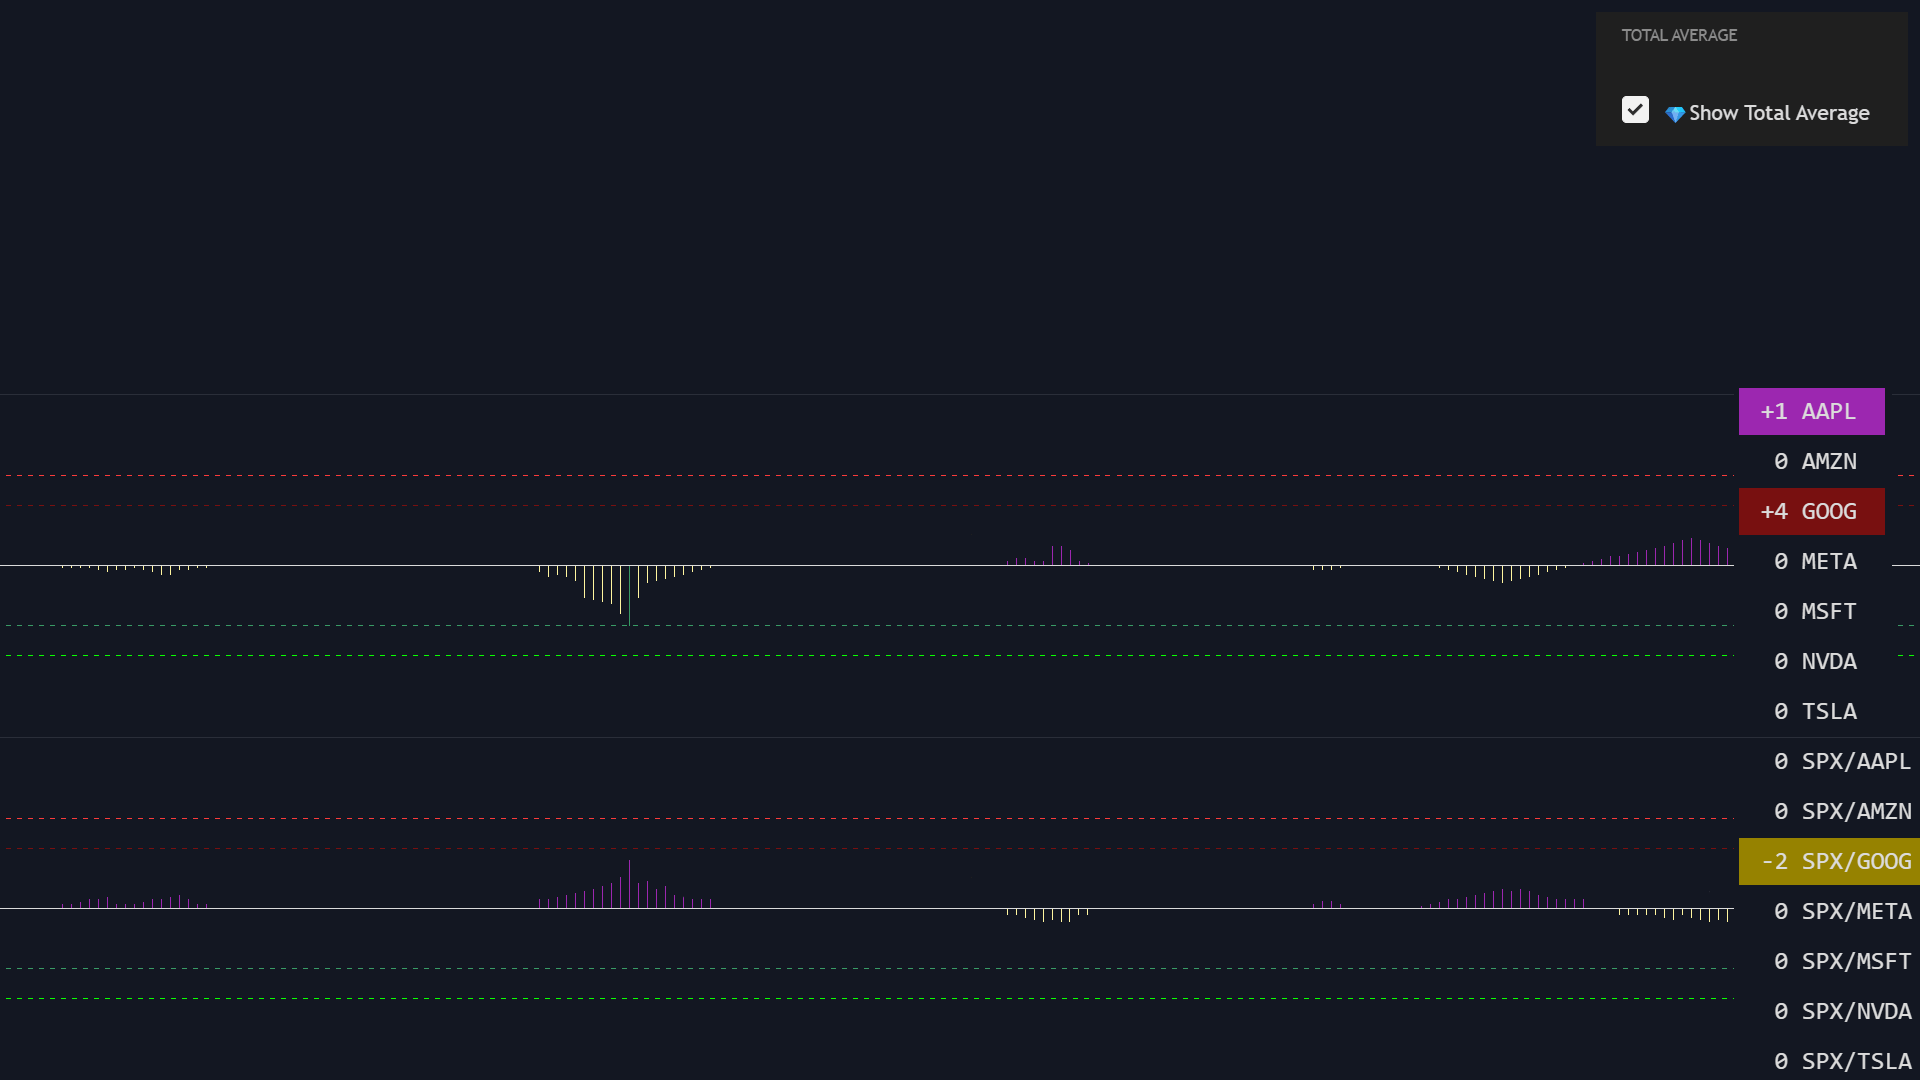
Average of all ranks in the list.
Enable 'Total Average' (default off; slow-compute).
Same rank logic: − oversold · + overbought.
Normal list — basket read.
• Valuation of group (less actionable).
◦ E.g., AAPL, AMZN… → MAG7 basket valuation.
Pairs (Chart/List) — chart vs peers.
• Valuation of chart vs list (more actionable).
◦ E.g., SPX/AAPL, SPX/AMZN… → SPX vs MAG7 valuation.
• Easy setup: 'Pair Configuration' = 'Chart/List'.
See it in action (<30s each):
Frequently Asked Questions. Select boxes to learn more:
📊 Ranks
Numeric Ranks that flag price extremes and momentum shifts.
🧮 +/− Rank
🟢Negative = Oversold (buy idea).
🔴Positive = Overbought (sell idea).
📏 Rank Size
Reversal Move: ±4=small, ±6=big, ±9=huge.
Bigger = rarer = higher opportunity.
🧊 Repainting
Ranks don't change/disappear after bar close. Intrabar pullbacks (wicks) don't modify ranks, price moving more extreme increases ranks.
⚡ Intrabar vs Close
No bar-close confirmation needed. Intrabar price changes can only make a rank become more extreme.
🕒 Timeframes
Lower (5m/15m) = more/faster signals.
Higher (1H/1D) = fewer/stronger signals.
Decide based on preferred trade/hold time.
📶 Rank Frequency
Fewer: ↑rank trigger or ↑timeframe (±6, 1D).
More: ↓rank trigger or ↓timeframe (±4, 1h).
Quality > quantity
🧩️ Confluence
Large-ranks also meet small-rank's short-term criteria to boost top/bottom accuracy. Many confluences occur behind the scenes.
⭐ Best Ranks
Best odds: act on extreme ranks (▲/▼ mark them by default). Use the Occurrences Table to see extremes or near-extremes. Learn here .
📖 Buy vs Sell Logic
Emotional FOMO (Fear of Missing Out) drives pumps more than dips. Effective sell ranks are usually larger than buy ranks.
🛡️ Manage Risk
🟢Buy Rank, set stop-loss near lows.
🔴Sell Rank, set trail stop-loss, lock-in gain.
Always size risks.
📈 Trends & Ranges
Works in trends and ranges; exhaustion logic favors mean-reversion edges.
🔗 Which Tickers
Any ticker (calculation only need price).
Improve confluence, also use unusual pairs. (Ex: NASDAQ:MSTR/INDEX:BTCUSD )
🦄 Rare Signals
Strict rules = fewer but better opportunities. If no signals, it’s best to be patient. No indicator can guarantee returns, but can increase odds.
🔔 Alerts & Screener
Alerts (and the screener) helps you stay patient and avoid having to stare at charts.
⚙️ Adjust Settings
Recommended: default length inputs.
Instead modify: timeframe, ranks for signals, unique ticker pairs (for hidden opportunities).
🏁 Extremes Differ
Extremes (▲/▼) only reference plotted bars.
Live Chart & Bar-Replay: 1st bar can differ.
Alerts: reference bars plotted at creation.
Old Alerts: 1st bar different than live chart.
🏆️ Why TanHef
Easy-to-understand signals makes trade analysis as simple as setting an alert. Signals are instant (many other indicators repaint or give late signals due to confirmation lag).
🔒Subscribe
Access both TanHef Ranks and Screener on TradingView.
🏆 Annual
- 2 Months Free
- Best Value
🔄 Monthly
- Cancel Any Month
- Most Flexible
🔒 Secure payment via Stripe
Request for Trial Access
Submit form or Message on TradingView for trial access.
TradingView Indicator + Screener • Easy-To-Read Signals • Alerts
Manual activation within 24h • No credit card • 100% Free Trial