Full description
TanHef Ranks
Overview
TanHef Ranks evaluates price movement across multiple lookbacks and expresses overbought and oversold strength through a Rank system. Smaller Ranks emphasize shorter-lookback conditions, while larger Ranks reflect confluence across shorter and longer lookbacks.
The indicator combines Chart Ranks, configurable attention flags, historical occurrence counts and optional multi-timeframe analysis in one chart view. The source is kept closed to protect the custom Rank calculation.
Reading Ranks
Read the Rank by its direction and distance from zero:
- Negative Ranks indicate oversold conditions.
- Positive Ranks indicate overbought conditions.
- Zero is the neutral baseline.
- Farther from zero means a stronger reading. For example, −6 is stronger on the oversold side than −3.
A Rank number is a strength reading, rather than a literal count of agreeing lookbacks or timeframes. It does not express the probability of a reversal or profitable trade. Calculation lengths and the maximum calculated Rank are configurable, and larger Ranks require sufficient history.
The Chart Rank always uses the chart’s timeframe. Review it alongside price to identify conditions that deserve closer attention. Overbought or oversold conditions can persist, and price can continue moving in the same direction.
Flags and Extremes
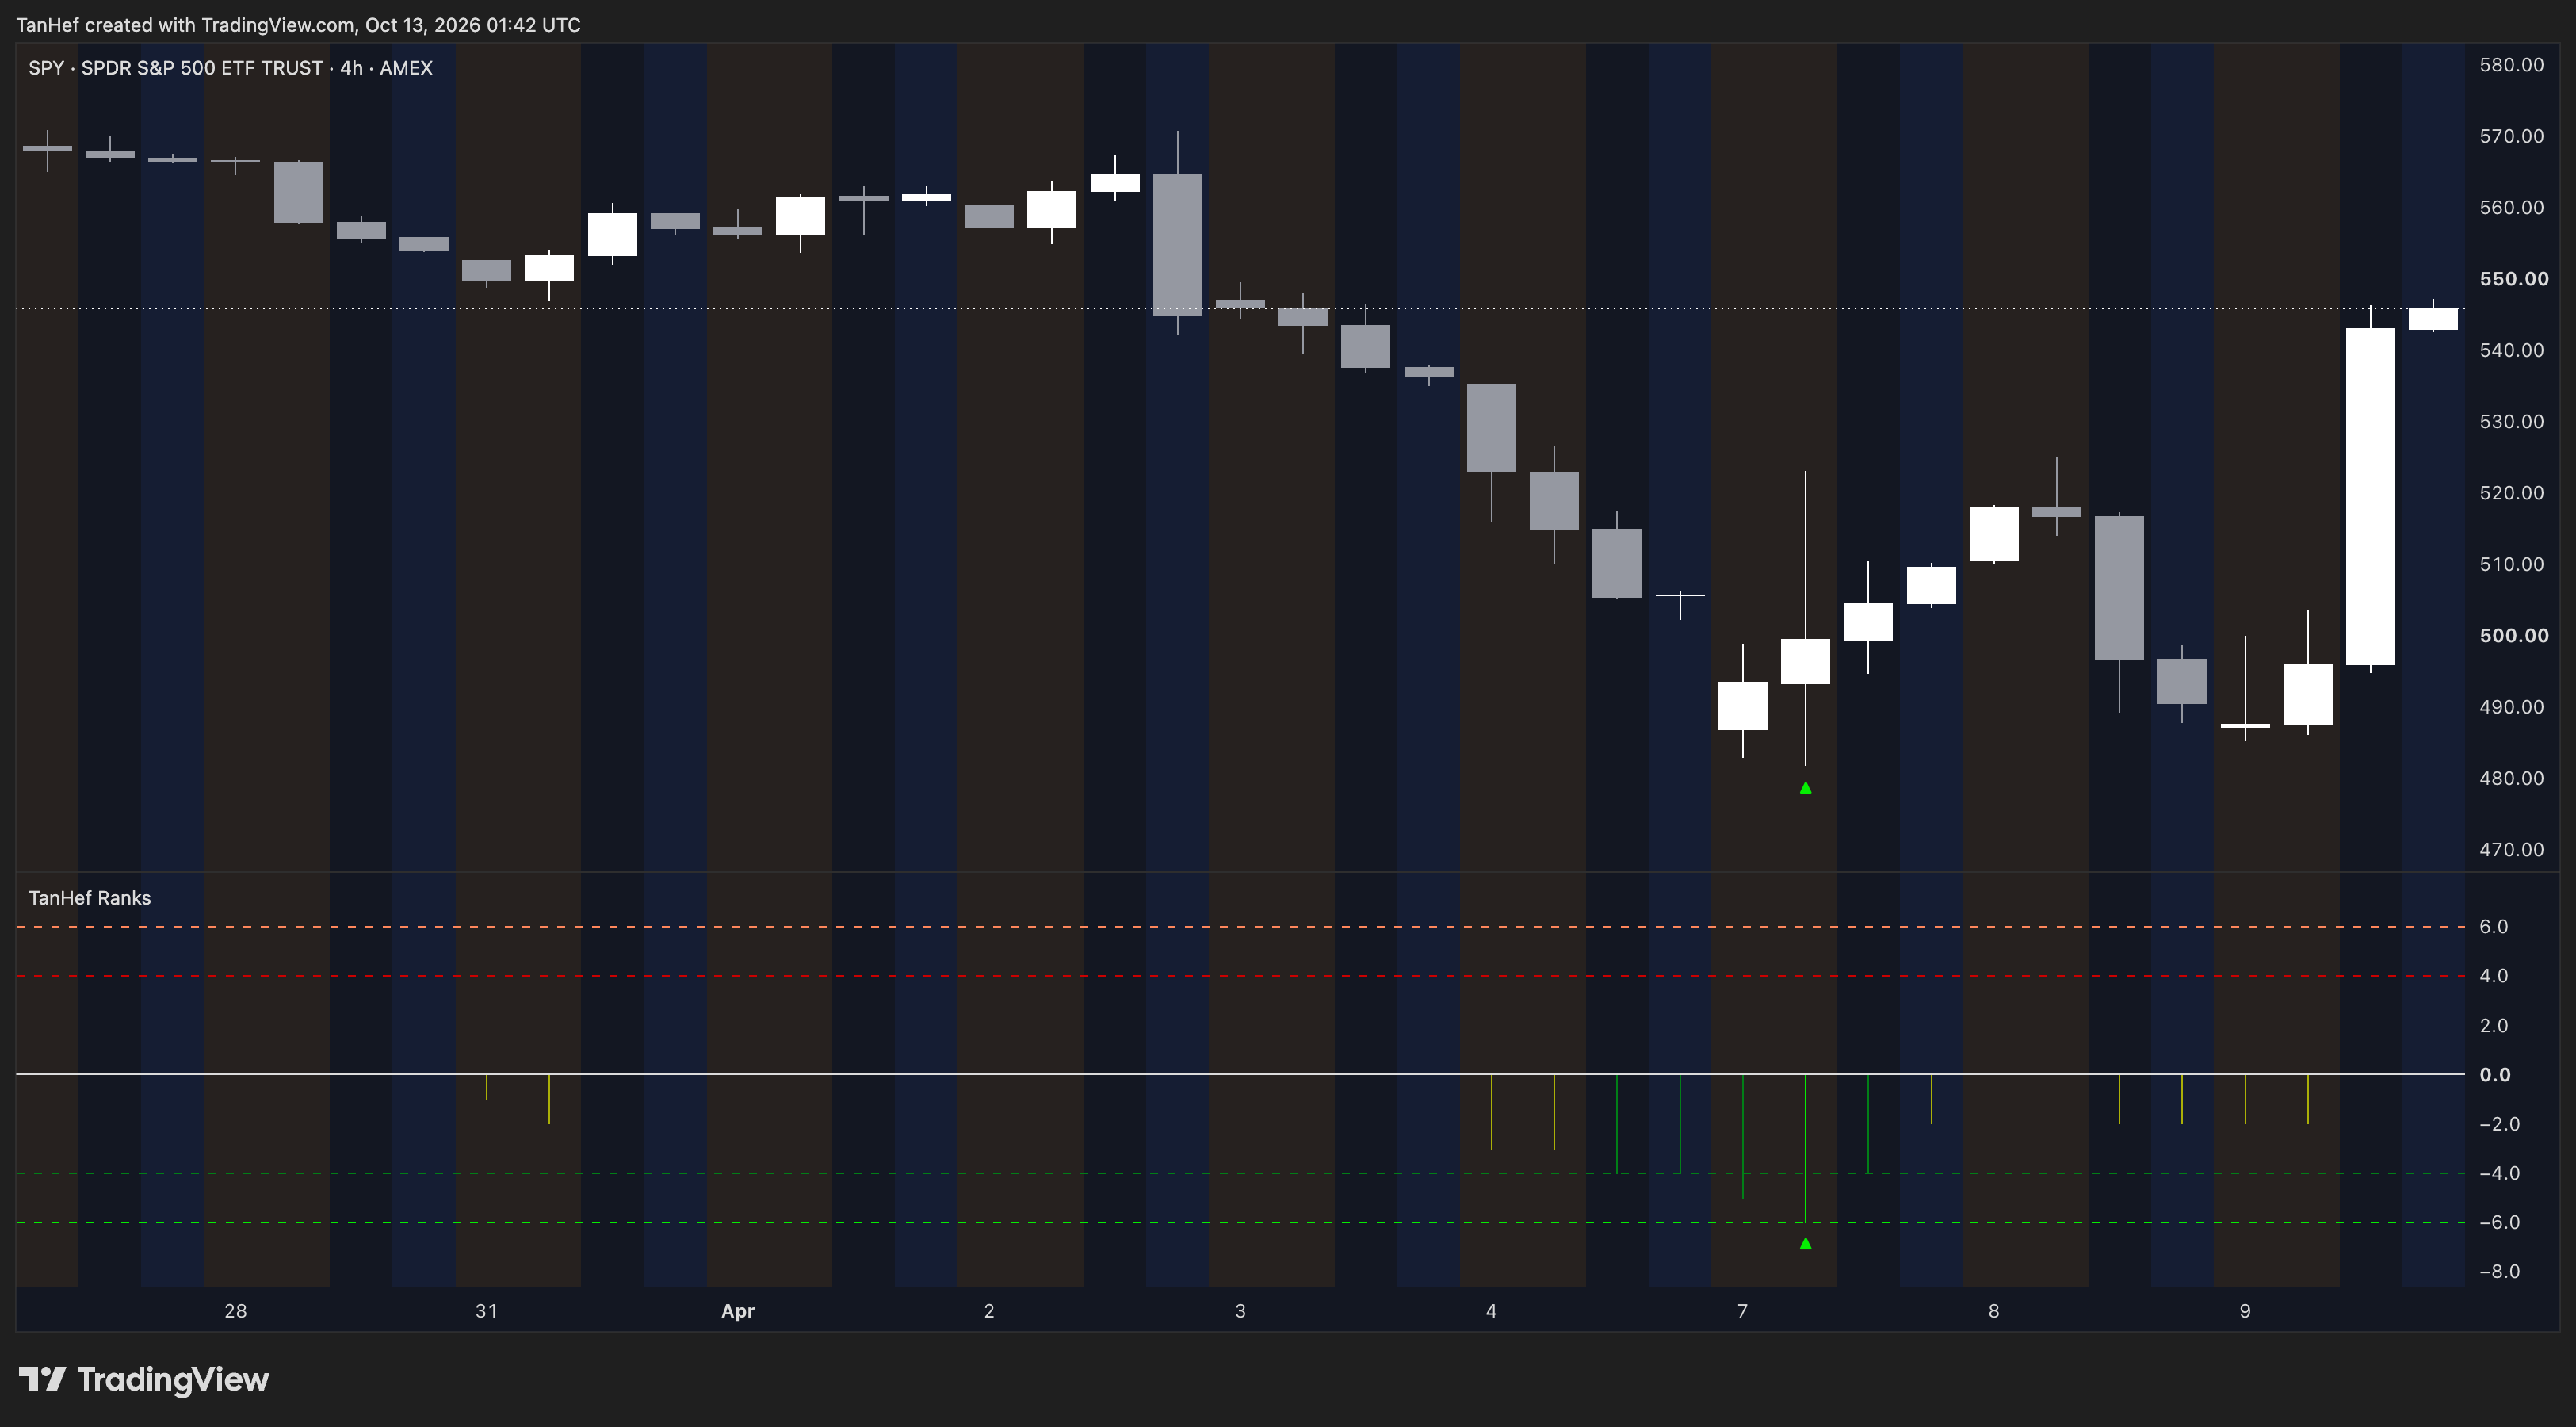
By default, ▲ marks an oversold Extreme and ▼ marks an overbought Extreme. An Extreme is the same-side Rank farthest from zero reached so far in the evaluated history. Equal readings can qualify again.
Extreme thresholds depend on the available history. A smaller Rank can qualify near the beginning of a dataset, while a stronger Rank may remain unmarked if an even stronger reading occurred earlier. Read the Rank number together with the flag and its historical context.
Flag symbols, placement and event criteria are configurable:
- All allows readings at or beyond the selected minimum to qualify.
- Stronger additionally requires the current same-side Rank to be farther from zero than the previous bar’s same-side Rank.
- Min Rank selects a fixed or history-based threshold, including Extreme.
Stronger can reduce repeated events, but successive readings such as −4, −5 and −6 can still qualify. Flags highlight the selected conditions; they do not confirm reversals or provide automatic trade entries.
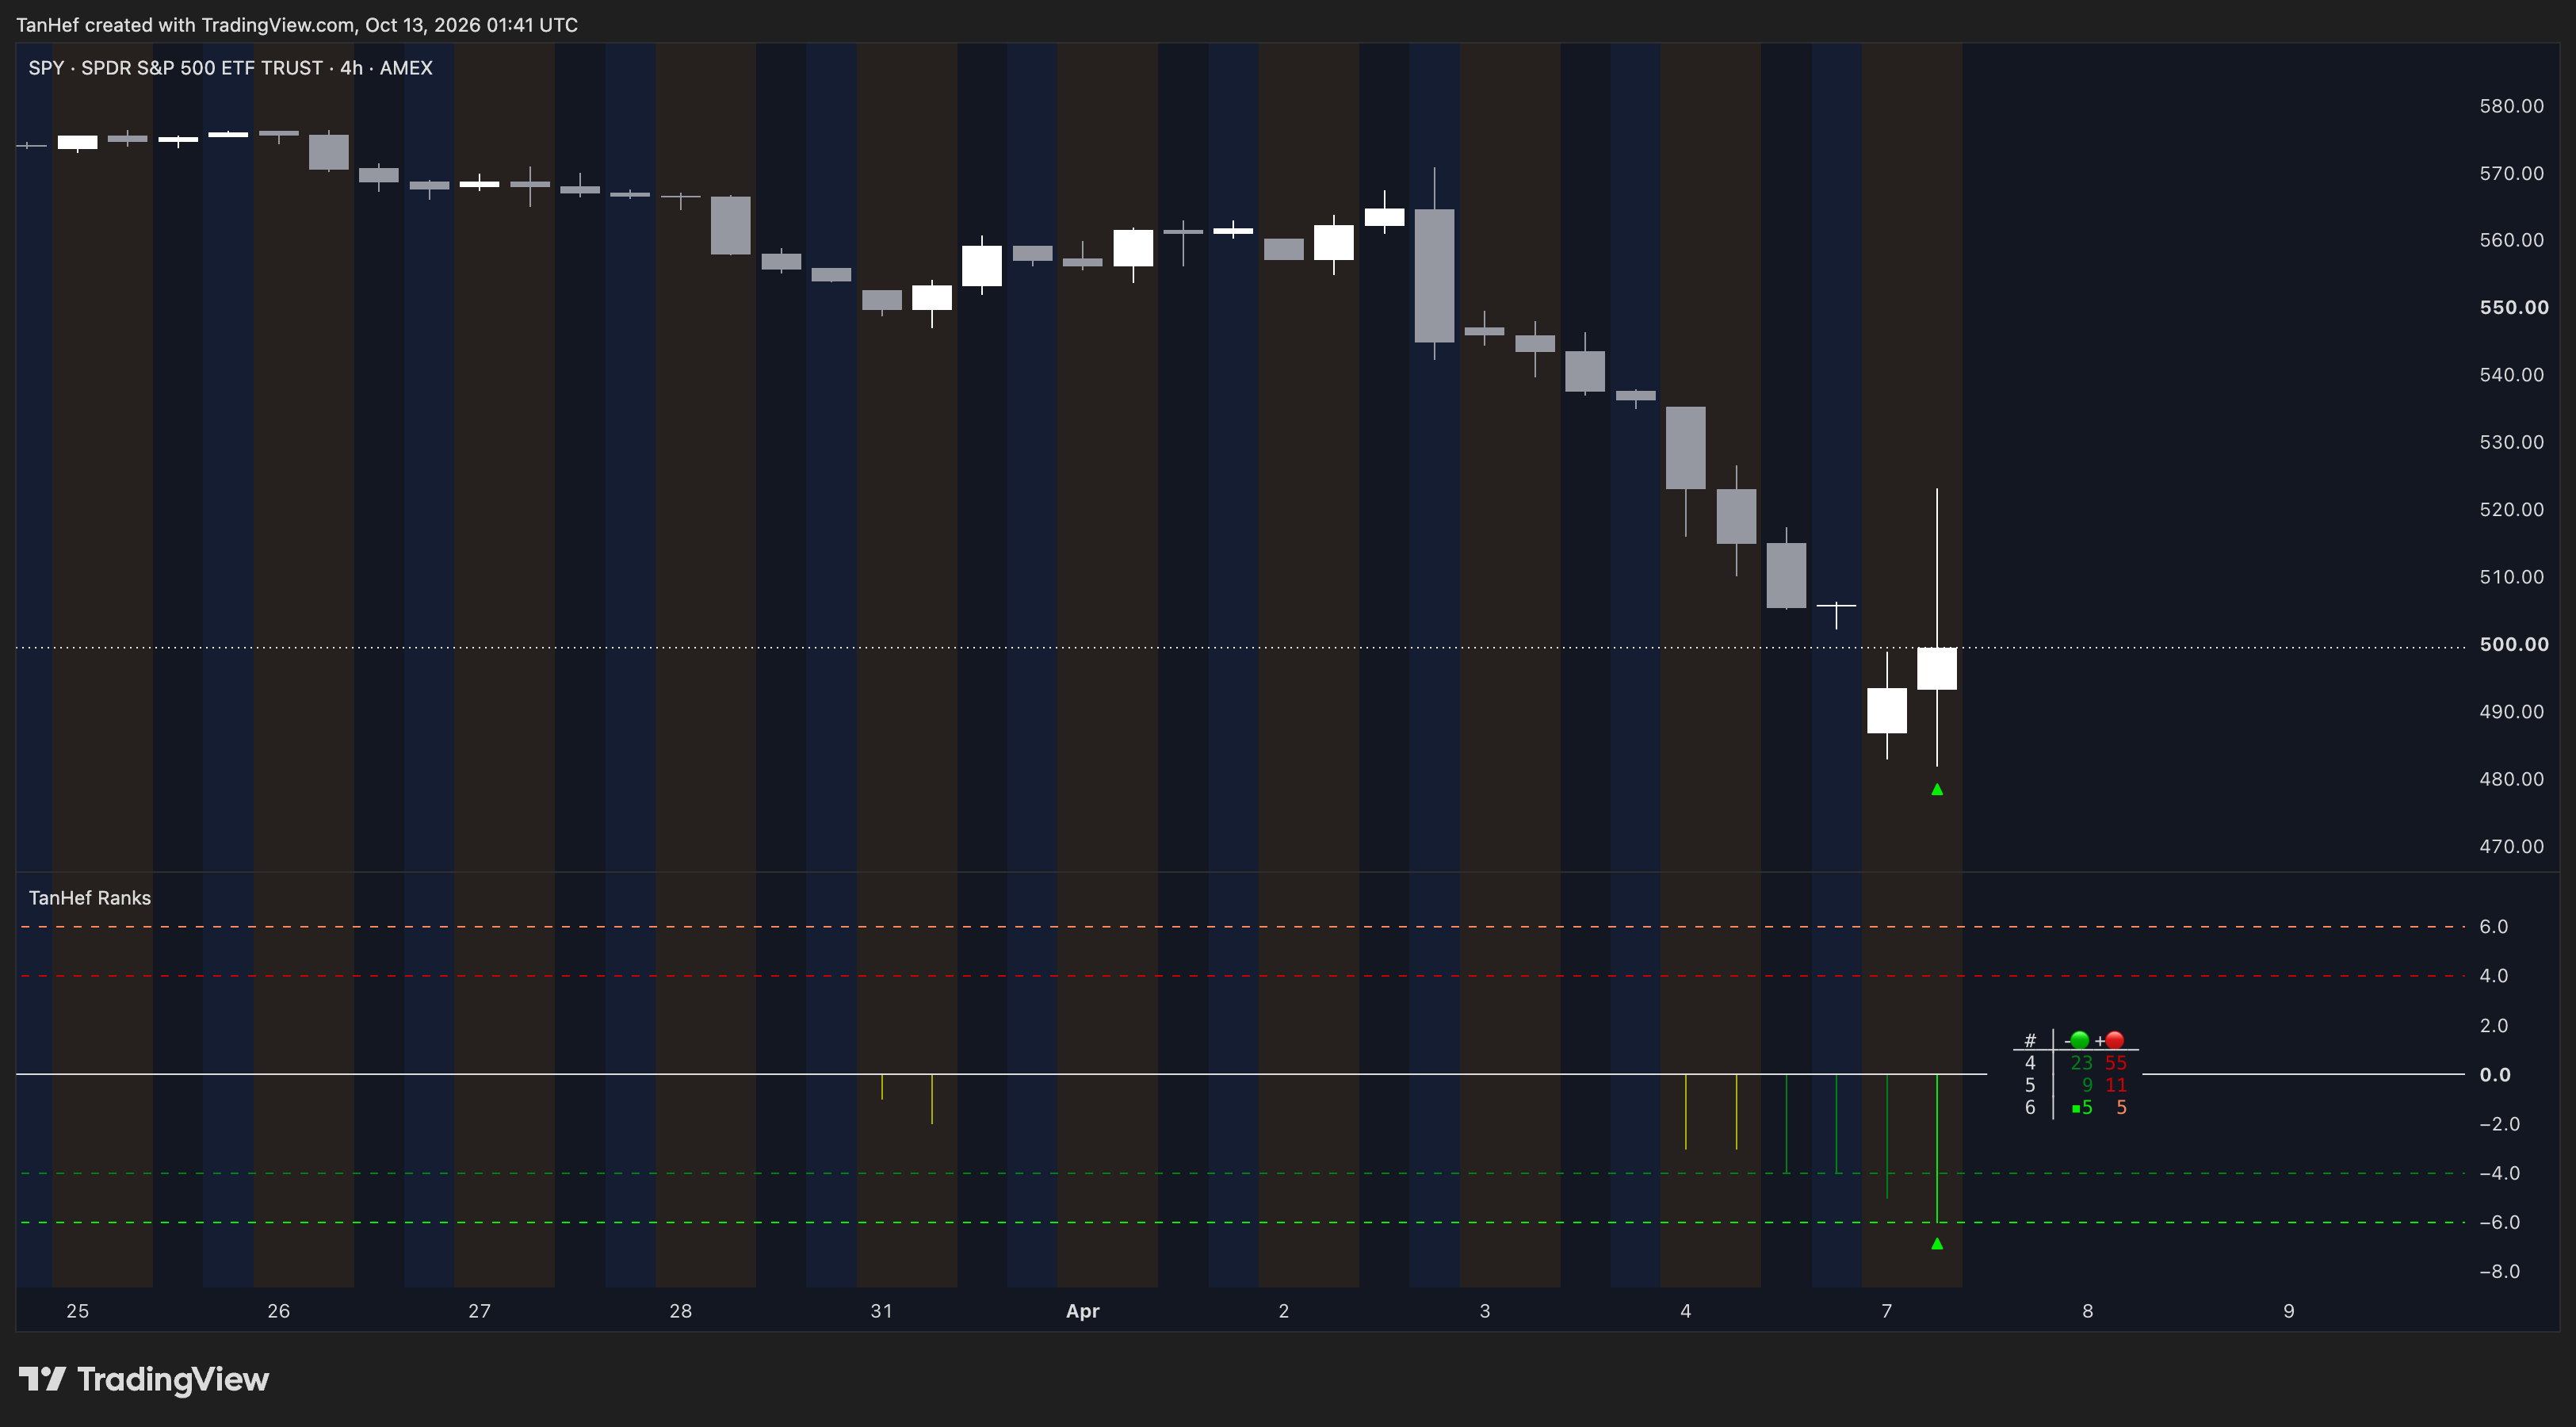
Historical SPY examples · 4-hour chart · Extended hours · April 2025.
Rank Occurrences
Rank Occurrences shows how frequently displayed Ranks occurred in the evaluated history. Hover the summary for additional details, including Extremes and Bar Coverage.
Bar Coverage describes the bars evaluated for the configuration. It is different from the number of candles currently visible on screen. With multi-timeframe analysis enabled, coverage can also distinguish source bars from the Chart-bar results they produced.
Occurrence counts describe the evaluated sample. They are not win rates or estimates of future reversal probability. Historical flag labels are subject to TradingView’s drawing limits, so occurrence counts can cover more history than the visible labels.
Multi-timeframe analysis
Optional multi-timeframe analysis (MTF) adds other timeframe readings:
- Lower timeframe: selects the positive and negative lower-timeframe Ranks farthest from zero within each Chart bar.
- Higher timeframe: evaluates each Chart bar in the context of confirmed higher-timeframe history.
- Separate or combined display: shows an additional timeframe separately or combines selected readings according to MTF Type.
Combined readings can be fractional. A lower-timeframe summary does not display every underlying candle individually. Available history, sessions, data and platform limits affect coverage, so an MTF series can begin later than the Chart series.
Alerts
To use alerts, configure the Rank event settings and Alert Frequency, then create a TradingView alert with TanHef Ranks → Any alert() function call. Frequency offers intrabar and bar-close choices and controls alert delivery timing; it does not determine when plotted Rank conditions qualify.
TradingView retains the script version, inputs and chart context used when an alert is created. Recreate the alert when you want changes to those settings or context reflected in its behavior. Alert delivery remains subject to data availability and TradingView’s platform limits.
Live bars and history
Live Ranks may change while bars are open. Closed Chart-bar results should remain stable when the symbol, timeframe, session, settings, data and loaded history stay the same. Revised data or different loaded history can change historical results and Extreme thresholds.
Using Ranks
Enable Show Quick Guide for an on-chart introduction, and hover settings information icons for further explanations. Use readings, flags and alerts within broader market analysis and your own risk framework. The historical illustrations demonstrate features and do not establish typical outcomes or future performance.