Full description
TanHef Ranks Screener
Overview
TanHef Ranks Screener evaluates a chosen list of symbols or ticker formulas and displays their Rank readings together. It supports individual-symbol analysis, ordered price-ratio comparisons and a configurable Total Rank summary.
Its custom Rank framework evaluates multiple lookbacks for each symbol or ratio. Smaller Ranks emphasize shorter-lookback conditions, while larger Ranks reflect confluence across shorter and longer lookbacks. The source is kept closed to protect the custom Rank calculation.
Reading Ranks
Read individual Ranks by their direction and distance from zero:
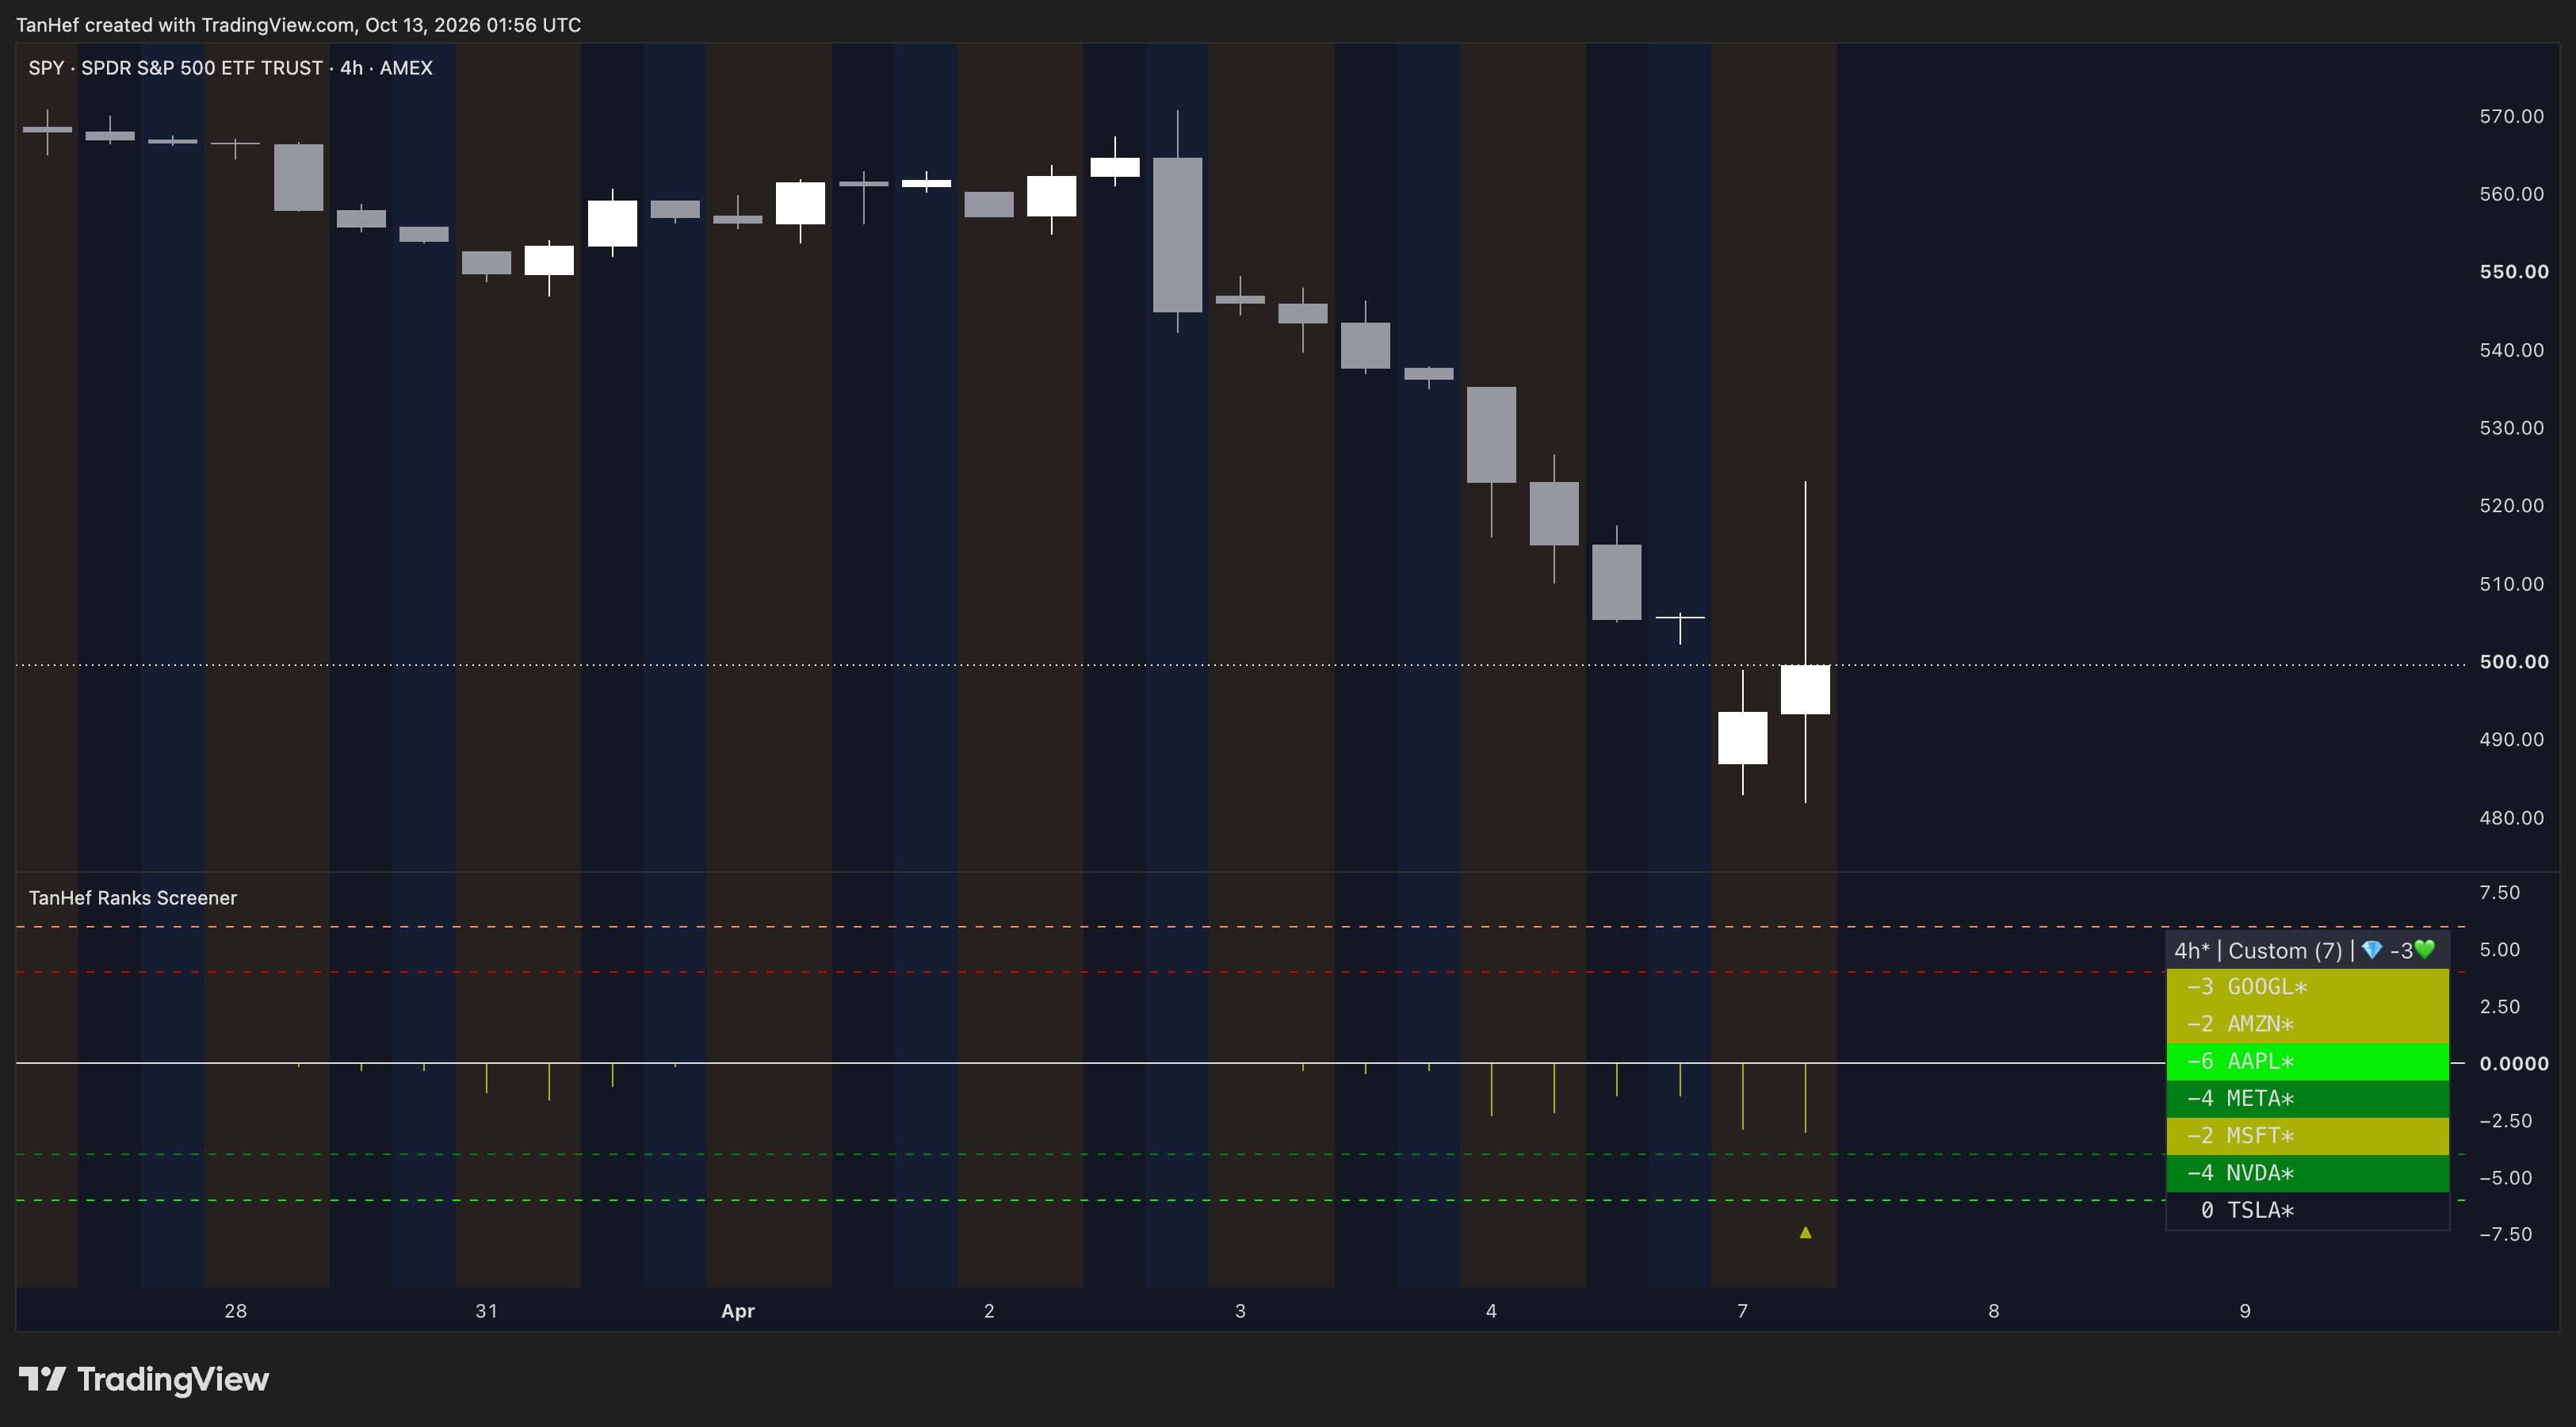
- Negative Ranks indicate oversold conditions.
- Positive Ranks indicate overbought conditions.
- Zero is the neutral baseline.
- Farther from zero means a stronger reading.
Rank numbers are strength readings, rather than probabilities or counts of agreeing settings. Calculation lengths and the maximum calculated Rank are configurable.
Symbols and ratios
Use Ticker Source to choose the entries and Auto Pair to select the comparison:
- List(none): evaluates each entry as entered. Plain symbols show their own Ranks; entered formulas are evaluated as formulas.
- Chart/List: places the chart symbol above each listed symbol, such as SPY/AAPL.
- List/Chart: places each listed symbol above the chart symbol, such as AAPL/SPY.
- Pair Input modes: use the selected comparison symbol with the list.
Read every ratio in the order shown. A/B means A divided by B. A negative Rank describes A as oversold relative to B; a positive Rank describes A as overbought relative to B. The reading applies to that ratio, rather than either symbol’s standalone condition.
Reversing a pair changes the analysis, and Rank magnitudes need not be equal and opposite. Keep the complete pair label in view when interpreting a reading.
Historical SPY examples · 4-hour chart · Extended hours · April 2025.
Total Rank
Total Rank summarizes eligible readings through the selected Filter → Cap → Center settings:
- Filter selects which readings remain in the summary.
- Cap limits the values used in the summary.
- Center determines how the retained values are combined, such as Mean or Median.
These settings affect the summary inputs while preserving each entry’s original Rank reading. For Total Rank, equally strong positive and negative Ranks produce a neutral input before Filter, Cap and Center are applied.
With Filter None, Cap None and Center Mean, Total Rank is the arithmetic mean of eligible signed inputs, including eligible zero inputs.
Total Rank can be fractional. Positive and negative readings can offset one another, so a Total near zero can coexist with stronger individual readings. Review the rows as well as the summary.
Duplicate entries count separately when included. Recognized self-pairs and unavailable readings are excluded. Total Rank is unavailable when no eligible readings remain. An unavailable result should not be interpreted as neutral zero.
Total Rank describes the configured collection of readings. It does not represent a basket price, investment return or agreement among every entry.
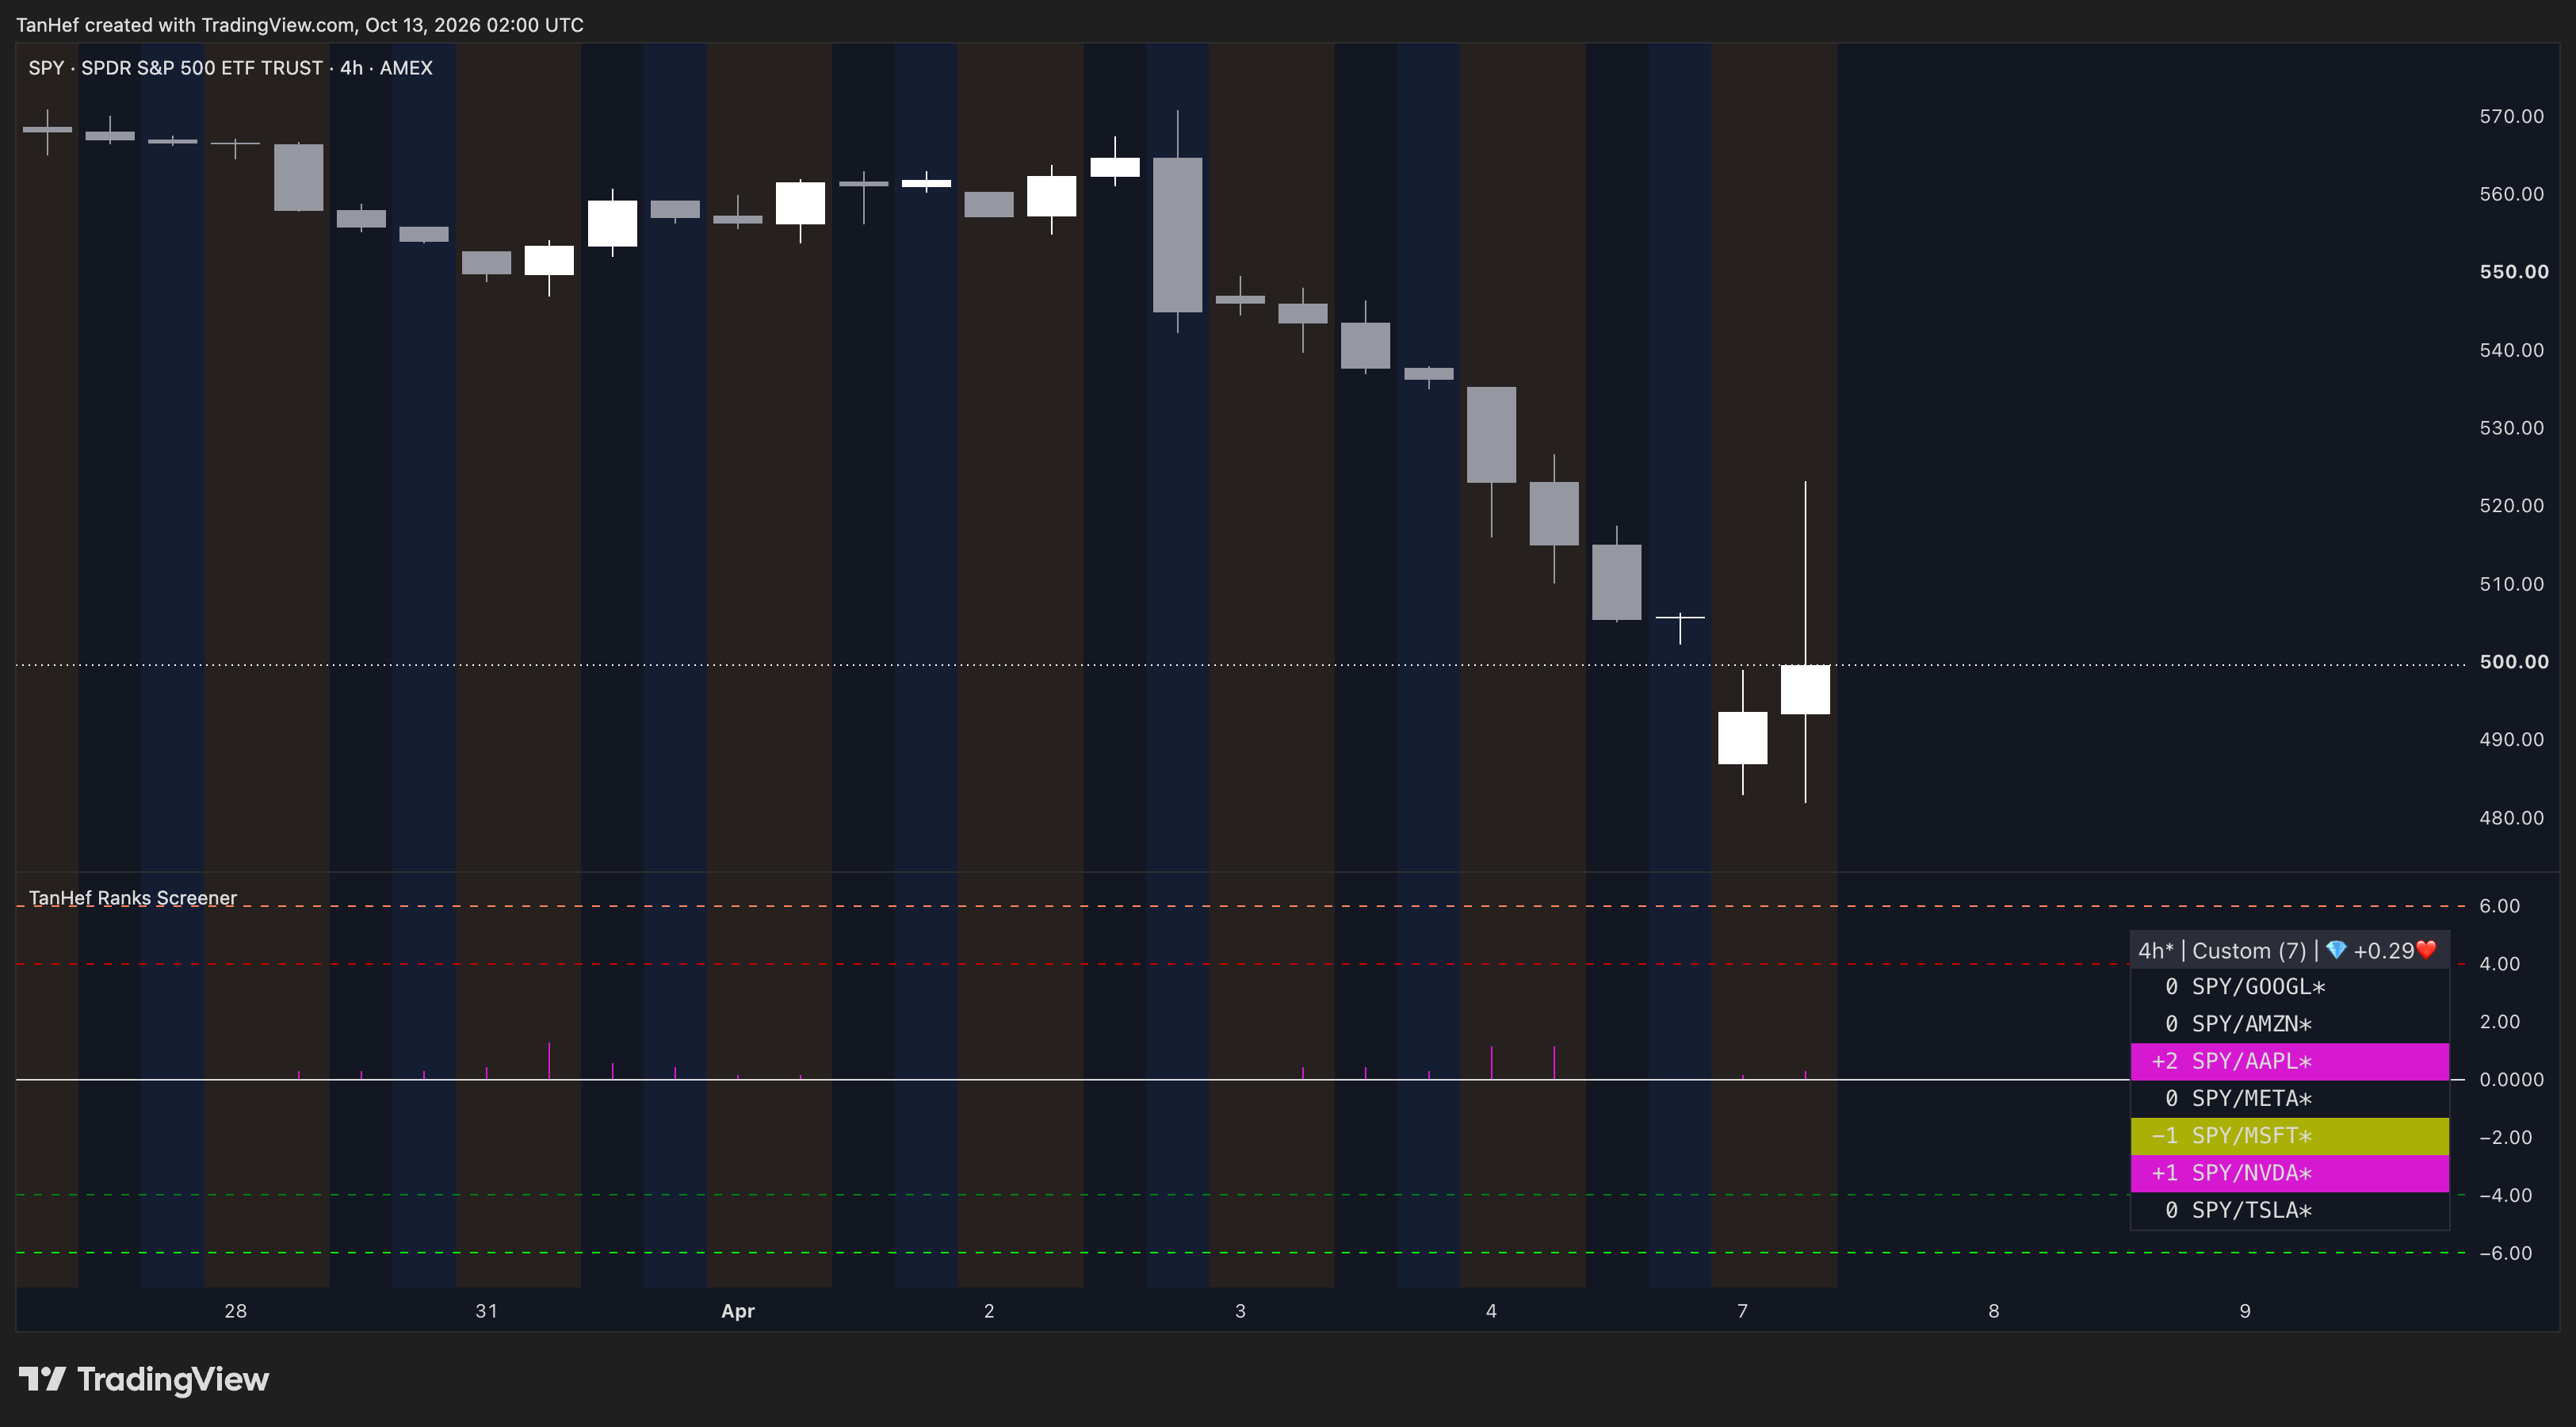
Ratio Ranks with SPY as the numerator, alongside Total Rank.
Extremes and occurrences
Optional historical features provide additional context for individual entries and Total Rank. An Extreme identifies the strongest same-side reading reached so far in the evaluated history. Equal Extremes can qualify again, and changing the available history can change the comparison.
Total Rank occurrence counts group fractional readings into signed ranges. For example, +1.7 belongs to +1.x and −1.7 to −1.x. Positive and negative 0.x ranges remain separate from exact zero.
These counts describe historical frequency within the evaluated sample; they do not measure trading success or forecast future outcomes. Historical flag labels are subject to TradingView’s drawing limits, so occurrence counts can cover more history than the visible labels.
Flags and alerts
Configure the Single Tickers and Total Rank event settings to select the conditions that deserve attention. All allows qualifying readings at or beyond the selected minimum. Stronger also compares the current same-side reading with the previous bar. To display Total Rank flags in the indicator pane, enable Show Total Rank and select the desired flag symbols.
To receive alerts, choose the event criteria and Alert Frequency, then create a TradingView alert using TanHef Ranks Screener → Any alert() function call. Intrabar and bar-close choices have different delivery timing. Available data and TradingView’s alert limits affect delivery, and frequent events can encounter platform restrictions.
Existing alerts retain their creation script version, inputs and chart context. Recreate an alert when you want changes reflected in its behavior.
Data and coverage
The Screener operates within its host chart’s context and available bars. A screened symbol can have different sessions or history from the host. Opening that symbol directly can therefore produce a different historical context.
An asterisk (*) in the heading or beside an entry marks missing current-bar data under the indicator’s data check. The latest confirmed Rank is carried forward; zero is not assumed. A carried reading should not automatically be treated as a fresh observation. Hover the table and entries to inspect symbol details, warnings and Bar Coverage.
Bar Coverage describes evaluated bars, rather than only the candles visible on screen. Invalid symbols, insufficient data, session differences and platform limits can prevent or restrict results. Larger lists and historical calculations can also require more loading time.
Live bars and limitations
Live readings may change while bars are open. Closed Chart-bar results should remain stable when the symbol, timeframe, session, settings, data and loaded history stay the same. Different history, revised data or changed context can alter historical readings and Extremes.
Use the Screener to review individual conditions, relative comparisons and the behavior of a configured group. Ranks, flags and alerts do not confirm reversals or provide automatic trade entries. The images are selected historical illustrations, not forecasts or evidence of typical trading results.